Click to learn more about author Steve Miller.
A year ago, I posted a blog on the disturbing 57% increase in Chicago homicides for 2016. There’s been no shortage of loaded commentary since, including strong if misinformed statements by the POTUS. A bit more balanced perspective was provided by fivethiryeight.
There can be no denying the off-the-charts Chicago homicide numbers — 493 in 2015, 777 in 2016, and 669 in 2017. But while Chicago had far more murders than other U.S. cities, New York and LA included, the murder rate (homicides/100000 population) was exceeded by several other metropolises, including Detroit, New Orleans, St Louis, and Baltimore.
With daily access to Chicago data (after a 7 day lag), I kept up with Chicago crime in 2017 and through the first quarter of 2018, looking for rays of hope in the data. Yet while there was a decline of over 100 homicides from 2016 to 2017, I was in no way inclined to claim even a minor victory. After all, the final 2017 number was still 175 more than in 2015 — so the decline could simply be regression to the mean.
What follows is a look at the 2001 through 2017 + Q1 2018 Chicago homicide and violent crime data. Though I don’t show the code here, the technologies deployed are JupyterLab with an R 3.4 kernel. The code was driven primarily through the R data.table, tidyverse and ggplot2 packages. A general frequencies function produced the counts.
The graphs hopefully tell a data story.
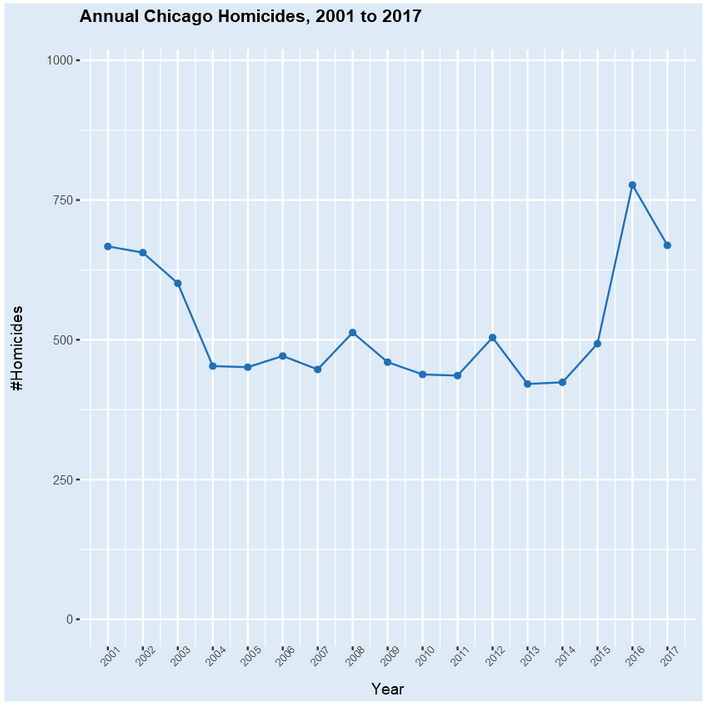
As detailed in the plot below, homicides in Chicago declined in the early 2000’s to a range from the mid 400’s to low 500’s before the explosion in 2016. Indeed, murder figures in Chicago were much higher in the 70’s, 80’s, and 90’s than they’ve been over the last 15 years, often exceeding 900/year, against a population up to 30% larger than today. Still, the 58% increase from 2015 to 2016 was both shocking and deeply disturbing.
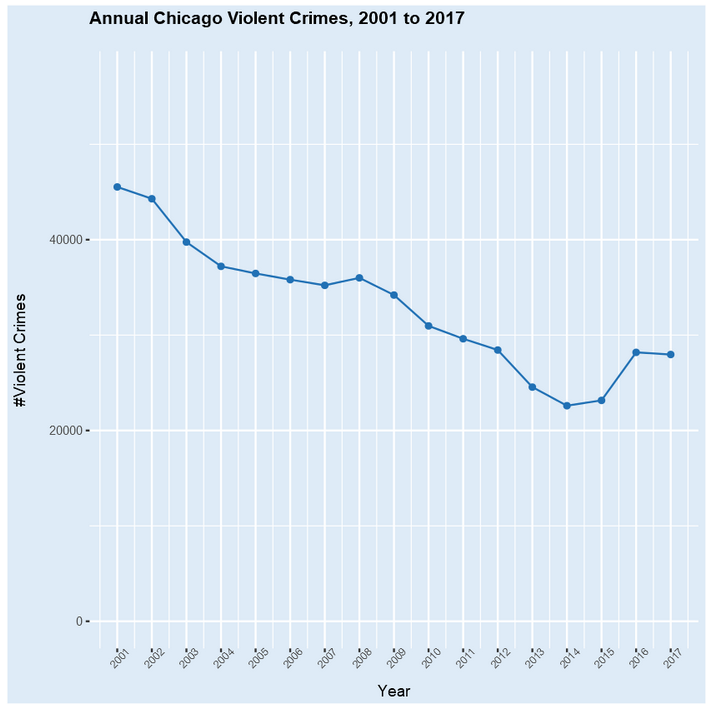
Violent crime, defined as homicide, criminal sexual assault, robbery, aggravated assault, and aggravated battery, has also declined steadily in Chicago, as it has throughout the country. That is, at least until 2015. The 50% decrease from 2001 to 2014 is impressive. The graph below tells the 17 year Chicago story.
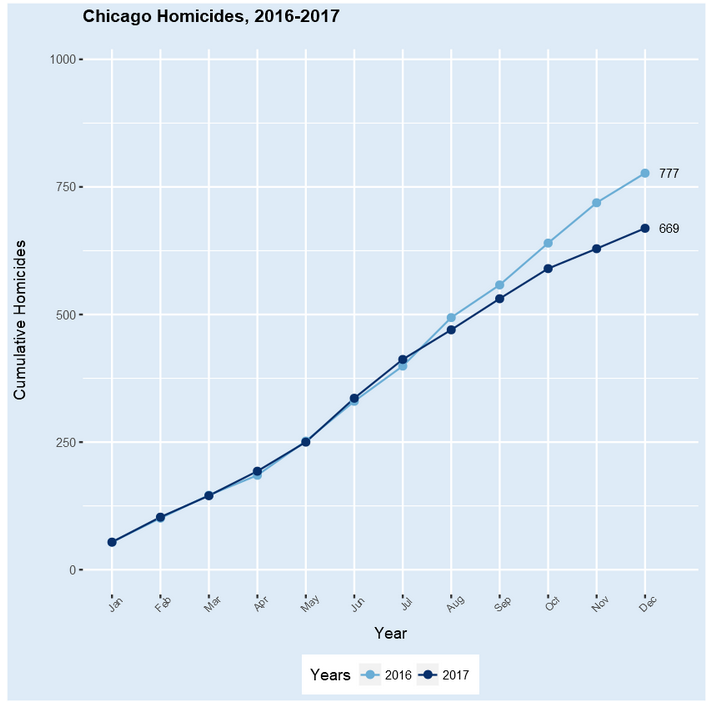
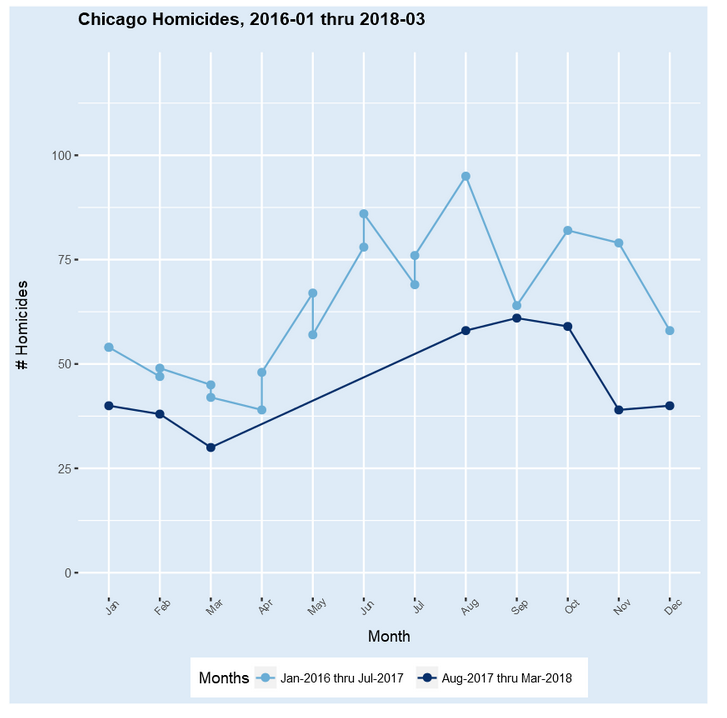
Given the alarming rise in Chicago homicides in 2016, was the 100+ decline in 2017 meaningful or simply regression to the mean? Contrasting cumulative figures by month (below) may provide a clue. The 2016 and 2017 numbers tracked closely through July, where 2017 actually exceeded 2016. From that point, 2017 homicides declined noticeably from 2016. From anecdotal evidence, this decrease aligned with beefed up community and analytics policing initiatives in Chicago. Might the efforts be starting to make a difference?
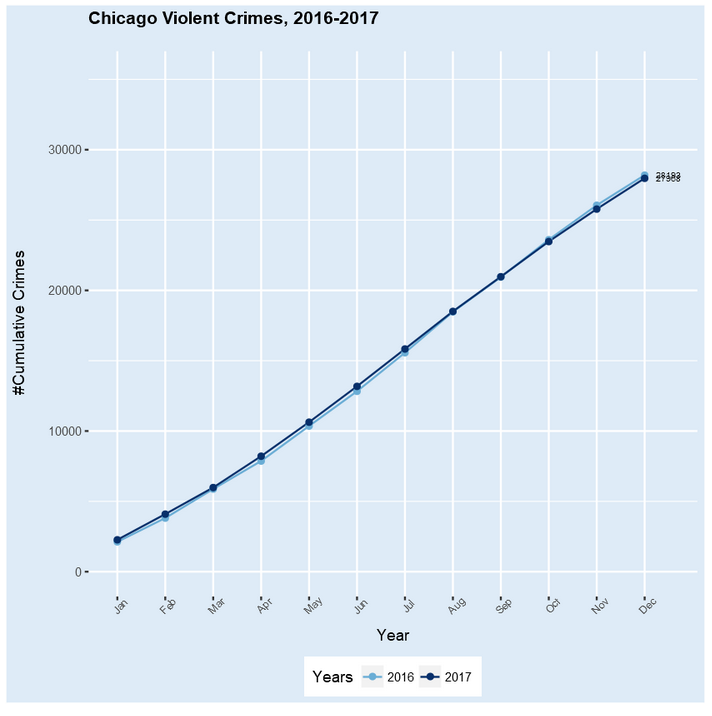
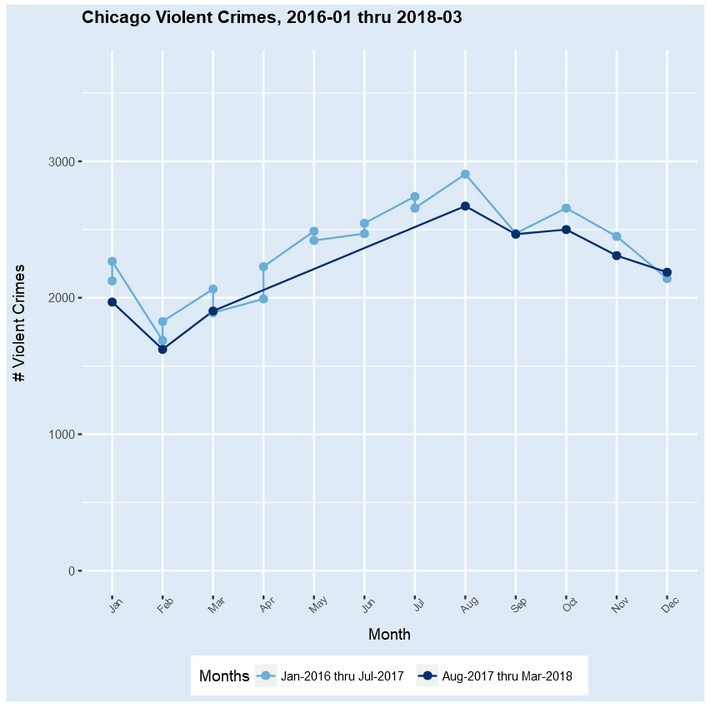
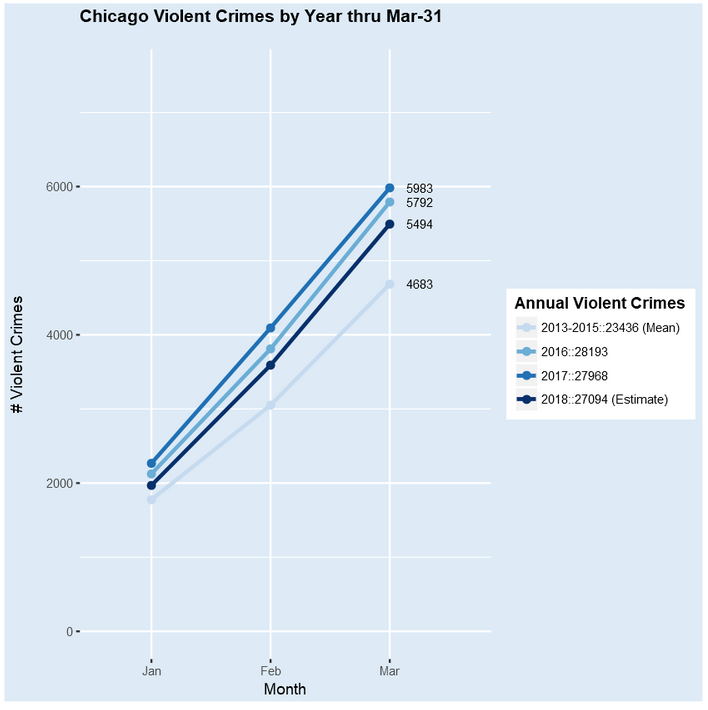
The cumulative pattern of violent crime is similar to homicide from 2016-2017, if less marked. Through July, vc was actually up over 2016, at which time 2017 relatively declined.
Now include data for Q1 2018. Does the decline of last 5 months of 2017 homicide persist? The analytics seem positive, as indicated in the plot below that juxtaposes the most recent 8 months with the preceding 19. While 8 consecutive months of comparative decline is heartening, Q2 and Q3 2018 will be the big tests. Historically, only 20% of annual Chicago homicides occur in Q1, while 30% are committed in Q3. Even so, there appears to be ample opportunity for continued monthly declines in 2018 over 2016/2017.
Ditto for violent crime, but on a smaller scale.
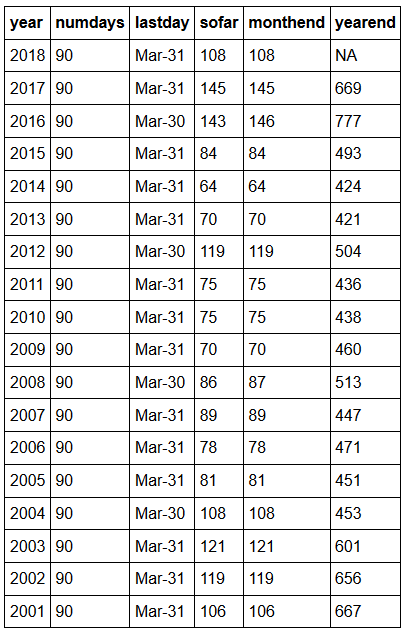
So what about forecasts for 2018 homicide totals in Chicago? Consider the following frequencies by year. In 2015, there were 493 homicides, of which 84 occurred in first 90 days of the year. In 2017, there were 777 for the year, including 143 in the first 90 days. This year, 108 homicides were recorded in the first 90 days. Based on the number so far and the 17 year time series pattern, a hybrid ARIMA/regression model predicts 565 murders for the year as of Mar-31 — a decline of 100 from 2017 and over 200 from 2016, but still 75 higher than 2015! A similarly declining, albeit less pronounced, forecast holds for violent crime.
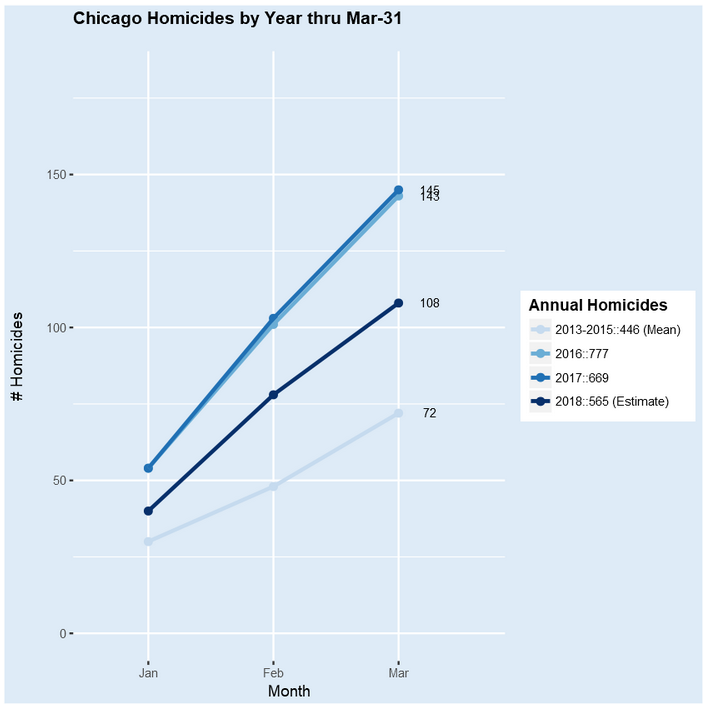
Now consider cumulative homicides in the first 3 months of 2018 contrasted with 2017 and 2016, using the mean of 2013-2015 as a “target” baseline. There’s a long way to go from 2017’s 669 to the target average of 446. But Q1 2018 appears to be pretty much in the middle of 2017/2016 and 2013-2015, suggesting that a 2018 forecast of 565 might not be unreasonable.
Overall, improvement but still a long way from the 2013-2015 baseline. I’ll continue to monitor Chicago crime in 2018, updating homicide and violent crime forecasts weekly. I’m unwilling to claim optimism at this point, yet do acknowledge I’m becoming hopeful.