Click to learn more about author Thomas Frisendal.
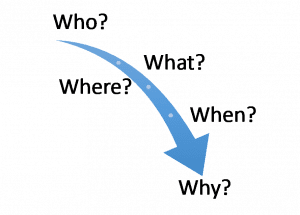
Losing your way is easy. Much of Data Modeling in the search, analytics and reporting spaces have been focused on the fabulous five W-words. The hope is to try to answer the Why-question:
We have been throwing technologies at this for quite some years now: Plain old Data Modeling, Semantics, “hyperindexes”, ontologies, topic maps, Data Warehouses, Operational Data Stores, multidimensional OLAP, mapping-intensive ETL, key/value pairs, Big Data and now also Data Catalogs, Data Lakes, and Knowledge Graphs.
Even alerts and exception reporting have been baked into reporting and analytics solutions for quite some time now. That must be because the “what is new?” question has a bit higher priority than the other ones as business moves on.
Over the recent holiday season I have been wondering, why it is that (Enterprise) Knowledge Graphs are getting so much attention? (And rightfully so, if you ask me). In particular, the analytics and reporting contexts stand to get much needed make-overs by way of new, graph-based navigation facilities.
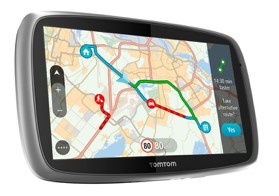
In fact, an appropriate everyday metaphor is well known to most people, the car navigation system:
(Image from www.tomtom.com )
The GPS navigation system answers most of the W-questions (except maybe for Who). And it even alerts you to roadblocks, congestions and recommended alternate routes to follow.
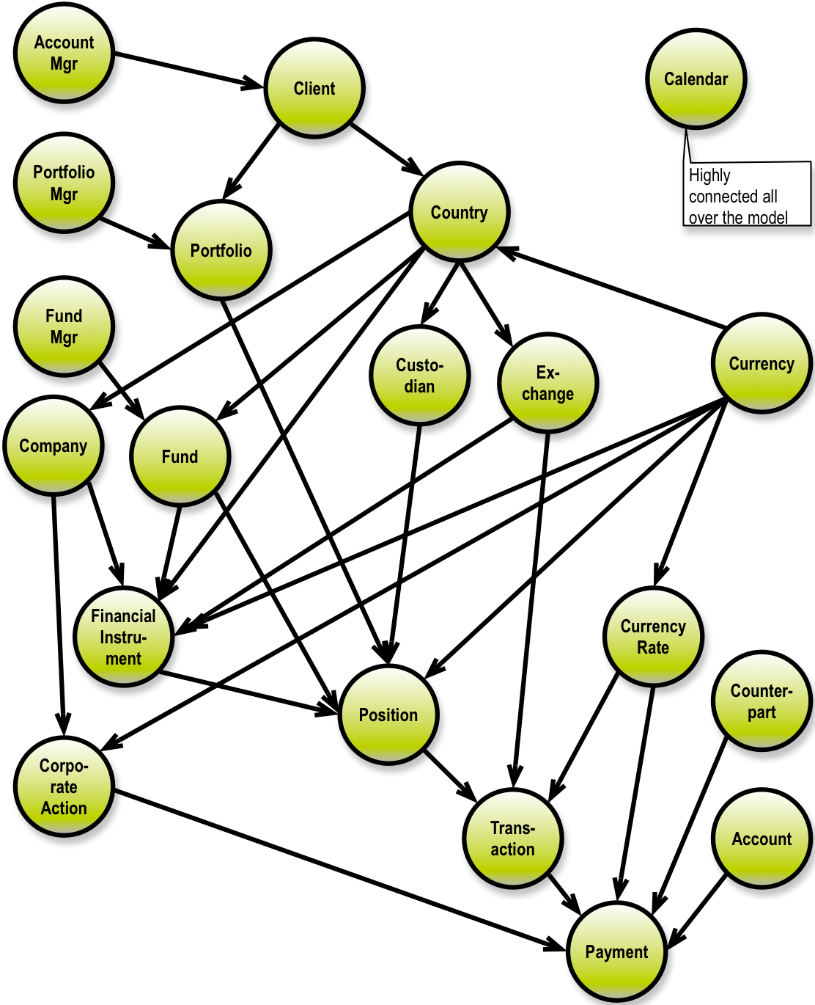
What should a GPS-inspired “information navigation system” look like to the business user? There are clear requirements for things like Semantics. There are also clear requirements for a intuitive representation of what essentially is an information map. All this should be available on rich sources of well-structured data providing easy navigation across a highly connected mesh of data; being an investment bank is not straightforward, as you can see in this grossly simplified asset management concept model overview:
Spice up the Knowledge Graph with interactive, dynamic, streaming(?) feeds of important new information (for example risk-related news) to the platform, and you are almost ready to go.
How can we build something like that? As you would expect by now, the answer is: by way of including Knowledge Graphs in the platforms, which we are providing. Knowledge Graphs are strong in Semantics (if you want them to be so), and graphs are elegant for navigating highly connected data. Graphs are also good for on-the-fly inclusion of alerts etc. on the right combinations of nodes of the context of the nature of the alert. A potential risk regarding a particular stock (Apple, for example) because of a large, unexpected sale of stock, would need to be connected to all the positions holding that stock and via them to the appropriate portfolio managers and clients potentially at risk in the situation. This is almost like a social network and that is another thing that graph technology is very good at. (Look up the Paradise Papers and see how that was done using Graph technology).
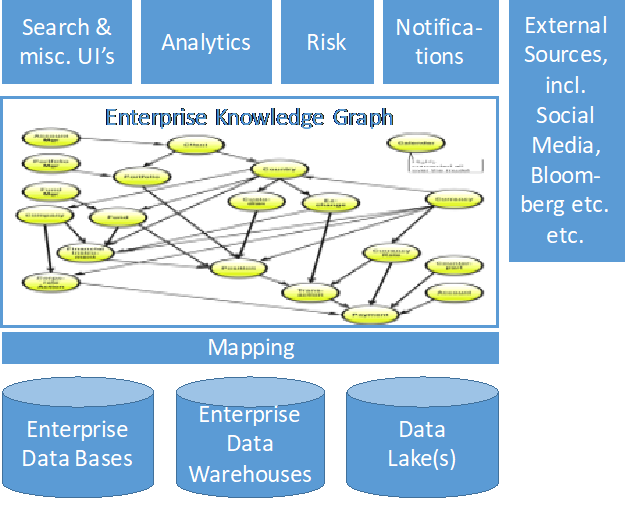
To get your Knowledge Graph going, you need (good) Data Models and as much semantics as you can digest, solid mapping between different data and a good Knowledge Graph on top of everything. There is more and more automation in the construction of Knowledge Graphs, by the way. In short, the architecture (in a financial sector context) will look something like this:
You will want to read external sources about potential risks, incorporate the information as news and you will need the capability of piecemeal risk calculations; the results of which can be elegantly inserted at the proper places in the Enterprise Knowledge Graph.
These are not just my words. One of the best presentations I attended in 2017 was:
“Knowledge Graphs: The Path to Enterprise” by Michael Moore and Omar Azhar of Ernst and Young in the US. The presentation was given at Neo4J’s Graphconnect NYC 2017 conference in New York in late October. Its examples are focused on the financial sector, but the ideas can be generalized easily.
I will give you a link to the recording at the bottom of this post, but let me first highlight a few opportunities, which are covered in the presentation:
- Building a communication network (graph)
- Customer 360-degree view
- Trader 360-degree view
- Risk driver graph (the driver map is a graph and is updated by trickle feeds)
- Smart search across everything (using Semantics and/or Graph search algorithms)
- Integration with machine learning
Thanks to Michael and Omar for their insightful – and very concrete – work, showing us what integration using knowledge graphs can do.
Do not get lost in 2018, see their presentation here: https://youtu.be/tvSgRX9_vP4
My best wishes for all of you in 2018! Let us achieve some good, new milestones, together!


