Click here to learn more about author Steve Miller.
It’s been difficult for me to ponder my 2016 stock index dashboard this week, the markets roiled by the turmoil of Brexit taking a toll on my fragile investment psyche. Alas, I dutifully update the underlying data and run the visualization daily, hoping for the best while expecting the worst.
The evening of each investment day, I download the data I maintain from the treasure trove of FTSE Russell index series. I chose FTSE Russell for both the breadth of its indexes and its data accessibility, settling on six classes of portfolios driven by company size, ranging from the top 200 to the bottom 2000 companies in the Russell 3000 largest companies in the U.S.
The data is downloaded from the FTSE Russell website using a python script invoked from a Jupyter notebook. The visualization was developed in Jupyter, R, ggplot2, and plotly – and ultimately stored in the plotly cloud. Plotly offers state-of-the-art visual capabilities built on a foundation of D3. And the plotly package in R provides the code-saving capability of powerful interactive graphics generated directly from R’s well-traveled ggplot syntax.
*Click the image above to see a larger interactive version of the visualization on the plotly cloud.
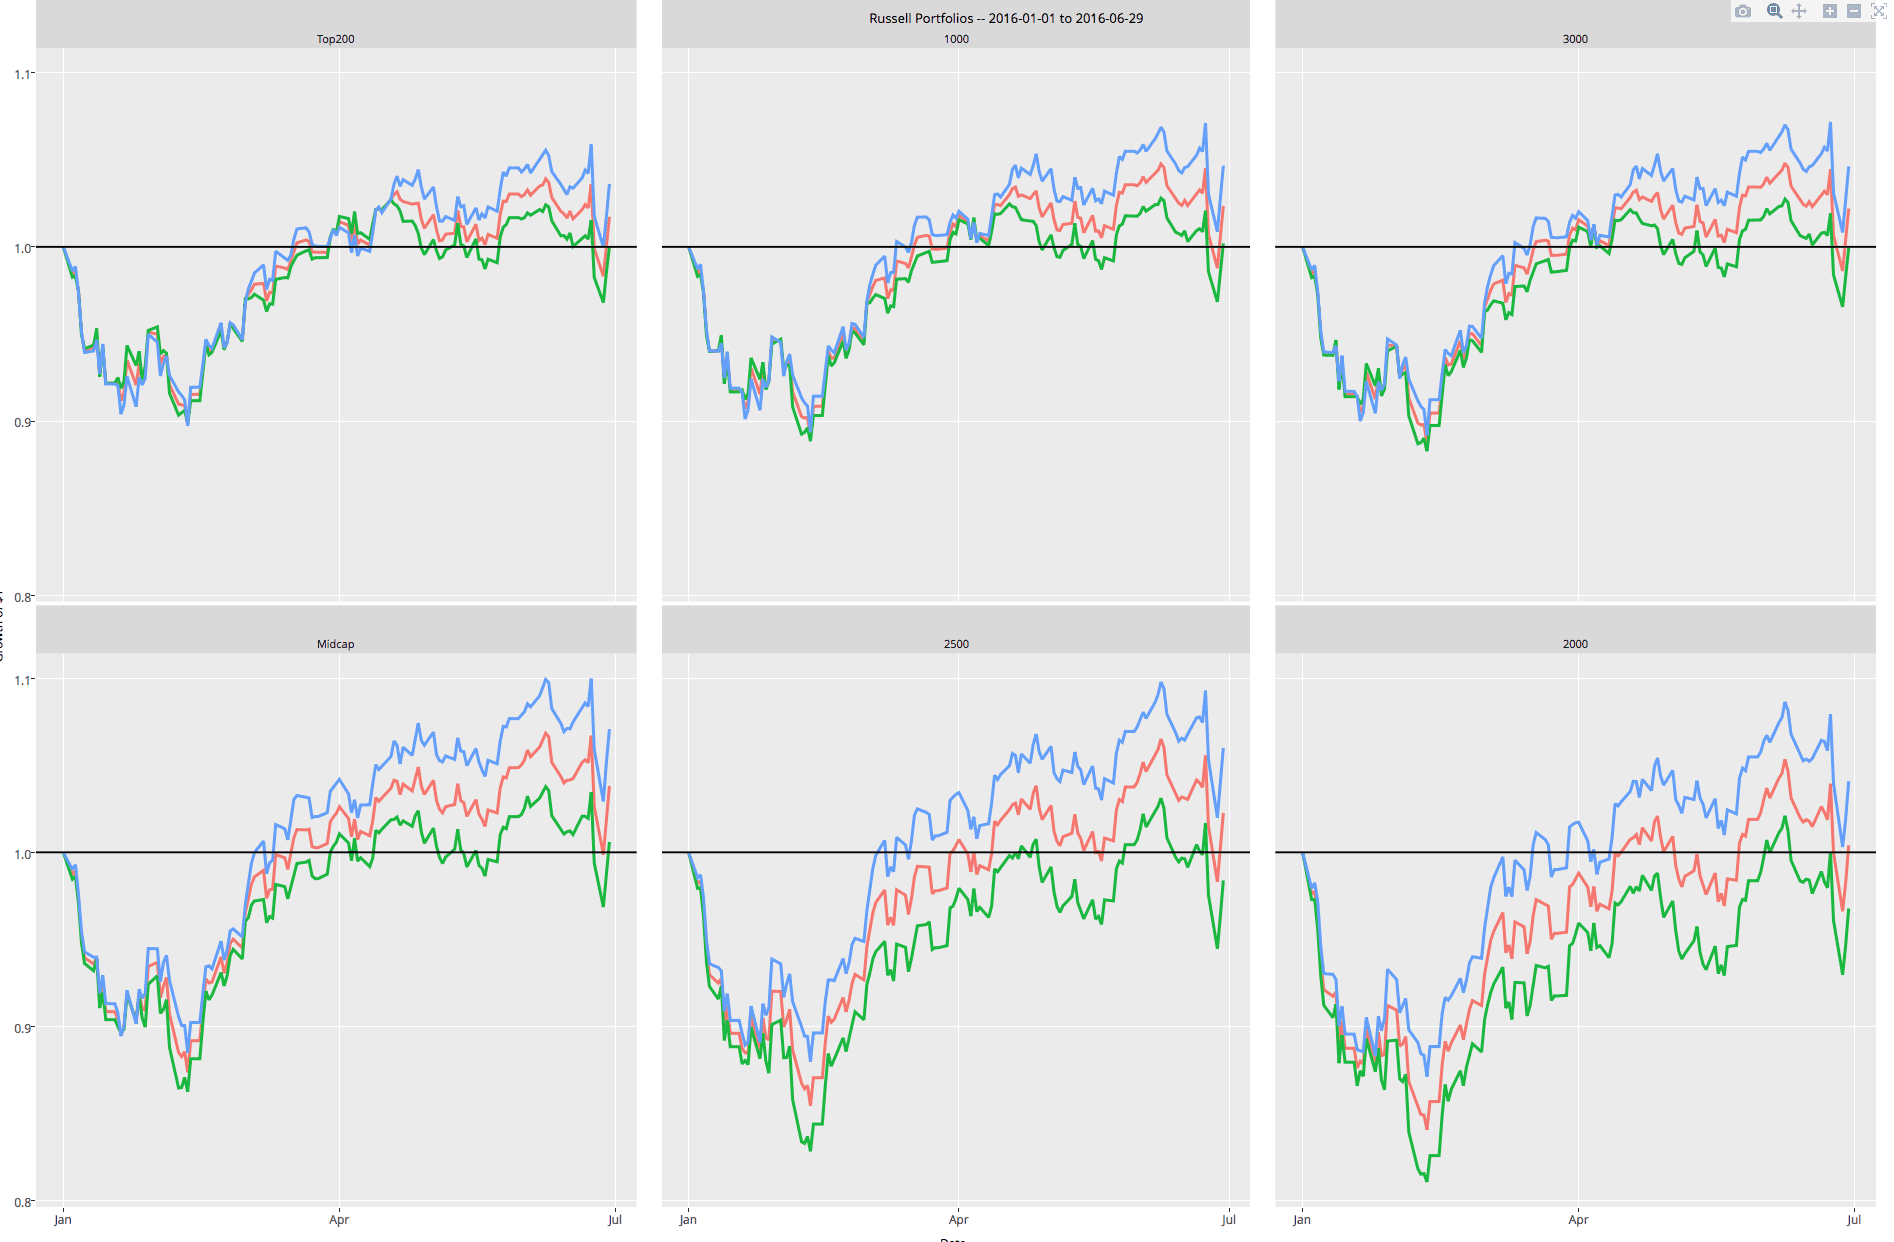
For each of the six size categorizations, I consider three portfolios dimensioned on the value-balance-growth continuum, making for a total of 18 tracked indexes in all. The dashboard monitors day-to-day performance of each in 2016, assuming all started January 1 with $1. The challenge was to showcase the data in such a way that’d make them all comprehensible in a single illustration.
Making sense of 18 graph traces in one dashboard is a daunting challenge. Thankfully, there are ways of organizing the plots into groupings/orderings that ease the cognitive burden.
The first “method” is using colors to denote the value-balance-growth dimension, identical shades indicating value, balance, and growth across the six size categories. The second is deploying a trellis or small multiple design with a distinct panel for each size. The power of trellis is that each panel has identical axes to facilitate between-panel comparisons. A third cognitive consideration is ordering, with portfolios comprised of companies of decreasing size proceeding from left to write, top to bottom. Finally, a horizontal reference line at $1 on each panel indicates starkly which portfolios are making and losing money.
Consider the graph above. The indexes are now starting to inch up after two days of precipitous Brexit decline, though you’d be better off on the sidelines for the most part this year. Note the wider separation on the value-growth axis of portfolios comprised of smaller companies. Midcap seems best on the size axis at this point, while for all sizes, value trumps growth.
Hopefully, the market will soon recover from the Brexit.