
Click to learn more about author Asha Saxena.
As I predicted that the virtual chief AI officer will be a trend in my last article. AI has become critical as we enter Industry 4.0. More than ever businesses need to pivot with the most massive shift towards the digital economy that has accelerated by the force of COVID-19 pandemic.
The move from brick and mortar to online digital transformation trend has been expedited by COVID-19. We now have a need to move and start incorporating emerging technologies into our business models. Small to midsize companies can choose to outsource and partner with a virtual CAIO consultant which is becoming a more useful and cost effective solution.
Building AI strategies needs your data organized, mined and ready to provide insights and use technologies like AI, ML, deep learning to expedite and modernize your services, products or capabilities.
Businesses are living in a big data world, where data is coming through from all many channels, devices, and data points. And this Covid-19 pandemic that accelerates the shift to using online technologies more will only create even more data for companies. Organizations are collecting data from social media, financial systems, market segments, customer data, supply chain, devices, and more. As companies collect all of this data, they may ask, “what is the value of all this data?”
Back in 2014, an article published in Bloomberg BusinessWeek includes an interview with Andreas Weigend, the former Chief Data Scientist at Amazon. In this interview he suggested that big data is like crude oil, if you refine it, then you get the value out of it.” However, not everyone agrees with that analogy. As Samuel Flender argues in his article, Data is not the new oil, he describes:
“The thing with oil is, once an oil company finds it in the ground, they know more or less which steps they have to follow to turn that oil into profits: drill, extract, refine, sell. This is far from the reality that you face when dealing with data. When dealing with data, it is far from clear how exactly to turn that data into profits.”
Now that you have the data, and people are trying to refine it, is your organization getting the value to make more scientific-based, data-driven business decisions?
If you want your organization to become data-driven with predictive data that facilitates decision-making, the big picture question is, can data result in revenue? This may include revenue-generating actions such as:
- Launching new product lines
- Launching new ideas
- Acquiring companies in mergers
- Helping to save on costs
- Creating efficiencies in operational systems, supply chains, or recruiting
- Aiding in external productivity to create new revenue
These are some areas that businesses are looking at, asking where they can get the most value for data that will turn into new revenue or increased efficiencies. Based on the current news and company data, we know that companies like Uber and Facebook are getting value. Just recently, Uber’s public offering drew criticism from analysts who believed their valuation was due to all the data they collect and how they leverage their ride-sharing platform’s technology for growth.
This shows that there are companies that have the right data and can make use of it effectively. They are “the winners,” while traditional companies are getting stuck and posing the questions, “How do we get there?” and “How do we make our organization more data-driven?” Some of these legacy companies are collecting a lot of data and struggling to find a way to make the best use of it or extract the value from it. They want to figure out where to find tangible value. This is the problem we are trying to solve.
What is the Solution? 7:15 Framework®
We’ve come across organizations that want their data cleaned, and they want a culture that is able to drive growth and revenue. Yet, there is no set guide or framework currently available in the market that provides a roadmap for how to implement this within their organization. They need a plan that has the ability to identify all of the elements that need to be taken into account for a data-driven project to provide high value.
My company has been doing research on a framework, and, during our research, we have discovered that there are seven primary objects and 15 secondary elements which create the framework. A total of 22 elements have been built into this framework to assist organizations in identifying and helping to assess if they are structurally ready to get high value from data. Here is a list of the top seven primary elements in the framework:
- The High Value
- Organizational Maturity
- Internal Competence
- Clear Objectives
- Data Governance
- Engagement
- Business Transformation
See the infographic below that shows the primary and secondary elements within the high-value big data framework. We explain each of the 15 secondary elements within each of the seven primary elements to help organizations define the steps they need to take.
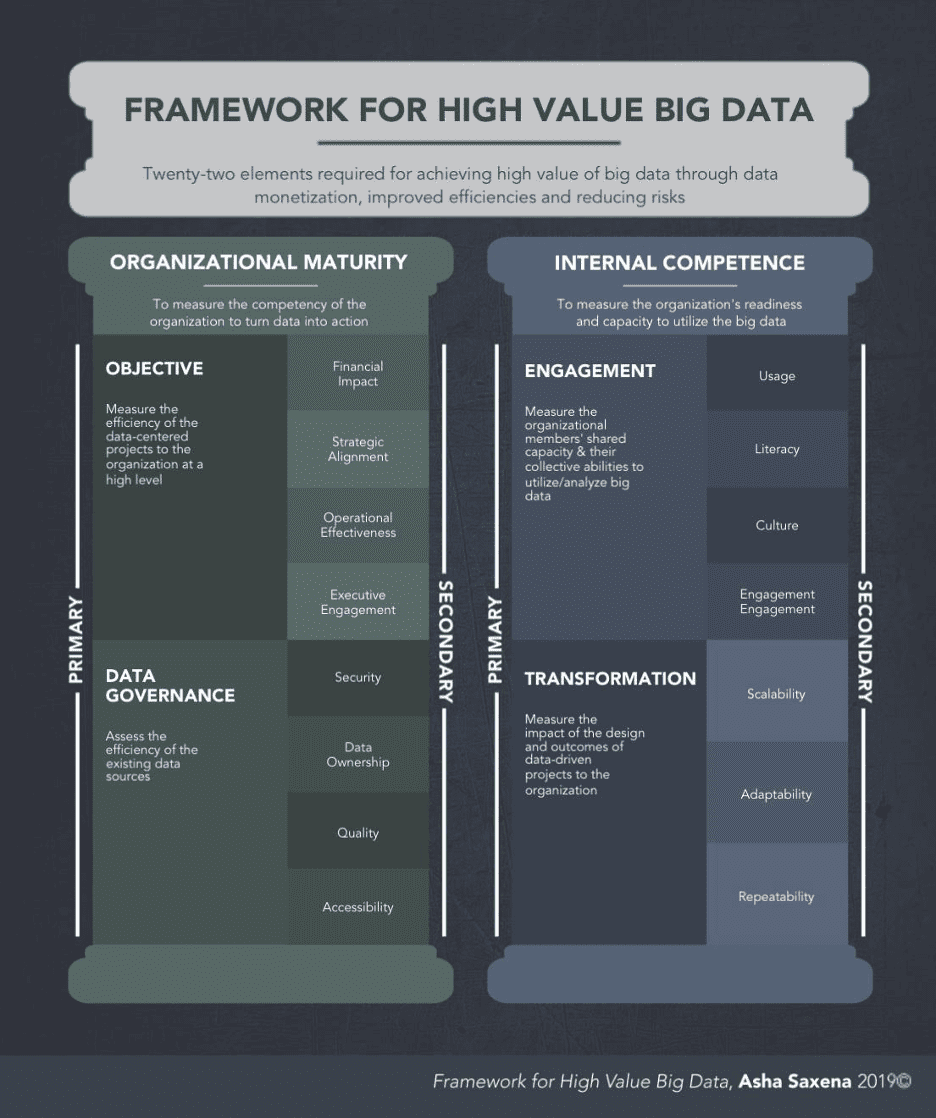
The top two pillars in the high-value framework are:
- Organizational Maturity
- Internal Competency
Organizational maturity is measured by the organization’s competency to turn big data into action. A mature organization has the capability to set clear objectives and governance.
Salesforce is an example of a mature, data-driven technology software company that has used its customer data to acquire Tableau, a data-chart visualization analytics company for $15 billion. Other enterprise software vendor companies have also been adding analytics and predictive capabilities to their software, such as Google’s recent purchase of Looker or SAP’s acquisition of Qualtrics. ZDNet’s editor Larry Dignan has discussed the deal, stating:
“[Salesforce] wants to get to a capability where they can visualize data much easier, which applies to almost every business role at this point as data becomes, kind of, the lifeblood of companies.”
Salesforce discovered that many of its largest customers were already using Tableau, so it made sense to acquire them and integrate the technology into their platforms, offering new analytics and rich interface capabilities. This acquisition will bring in $1.4 billion extra in annual revenue to Salesforce and will help them become even further integrated into enterprise customers’ data stacks.
They want to be a digital transformation engine of the enterprise. This includes leveraging the cloud, self-service, and machine intelligence-assisted analytics to tap into data across an entire business and surface deeper insights to make smarter decisions, drive intelligent, connected customer experiences, and accelerate innovation.
Technology leaders like Salesforce, which has the largest market share for businesses using Salesforce for their customer relationship management toolset, understand that the world’s businesses need a strong understanding of their customer data and a further deep dive into predicting customer behavior. By acquiring Tableau, they can now provide a more holistic toolset that will not only help businesses gather and organize their customer information but also be able to go deeper into actionable data, enabling them to provide the right services and products for the benefit of gaining a competitive edge.
Objectives (Foundation 1)
Clear objectives are set across the organization in terms of:
- Financial Impact
- Strategic Alignment
- Operational Effectiveness
- Executive Engagement
The organization needs to understand the financial impact: the cost of taking on a big data initiative versus the direct financial benefits this data initiative may bring to the organization. The organization needs to plan objectives in strategic alignment with staff, linking staff members to each objective.
Operational effectiveness is another element of the foundation of objectives. Will it make sense operationally to take on this large data project? Discussion within the organization should center on whether the management and analysis of this data will do more good than harm. Above all, C-suite executives need to be all-in and on the same page in order to bring in staff, ensure follow-through and engagement of employees, and provide resources to fulfill the duties necessary to bring about the data initiative.
Netflix is a good example of a company that uses data to set clear objectives, from C-level down to the engineering teams for every project initiative. One illustration of this was when they were transitioning from DVD rentals to the streaming subscription business model. They wanted to better understand customer behavior and why some users binge-watched back-to-back episodes of one or two shows at a time. So, they set up a data-driven objective by building algorithm-driven recommendations within their platform to keep customers engaged with Netflix’s service for hours on end. The objective was: Make the company’s recommendation engine 10 percent more accurate to reduce paying customer churn.
They came up with an outside-the-box idea to run an algorithm prize contest, in which the winner would get $1 million and recognition, with software engineers (outside the company) that could “substantially improve the accuracy of predictions” and develop personalized algorithm recommendations. The prizewinner, BellKor Pragmatic Chaos team, stated to Thrillist, “We gave them our code. They definitely did implement and use those breakthroughs that we made in the first year.”
The first personalized recommendation systems had star ratings, which later were replaced with a new thumbs up and down system. Netflix realized that explicit star ratings were less relevant than other signals and feedback. Once they transitioned into a streaming-only platform, they realized that actual viewer behavior signals such as someone stopping a movie, replaying a section, or only watching two minutes of it and never coming back, were so much more accurate in predicting what customers were likely to watch next.
Data Governance
The second foundation under the organizational maturity pillar deals with Data Governance.
- Security
- Data Ownership
- Quality
- Accessibility
Data Governance aims to assess the efficiency of the existing databases/data sources. To establish Data Governance, the organization should address four elements: data security, data ownership, data quality, and data accessibility.
How secure is the data within the organization? As part of Data Governance, data security takes into account the extent to which the digital system prevents unauthorized access to computers, databases, and websites to protect customer or patient data. This leads to questions for the IT department or team within the organization (or whoever owns the data). What standards and procedures are set forth from the owners of the data about how the data will be used?
Furthermore, the organization needs to assess Data Quality, thereby measuring the condition of a set of values containing qualitative or quantitative variables that prove beneficial to the organization. What is the quality of the data? The collected data should not be redundant, should not have null values, and should not include duplicates and errors.
Finally, how accessible is the data to different people in the organization? This accessibility needs to be taken into account for others within the organization to get all staff involved with the objectives.
One particular set of questions that I am often asked are:
1. Does the value of data change with time?
2. Is real-time data more valuable than older data or vice versa?
3. Under what conditions?
The answer to these questions about whether data value changes when we are thinking about real-time data vs. older data will depend a lot on what your objectives are.
If you are looking to analyze trends, you may need older data. But if you are a company that is only looking at real-time transactions, then real-time data will be more important or provide more value to the business.
eBay is a global technology company that enables eCommerce transactions at scale. eBay, working together with Deloitte, kicked off a Data and Governance program using Informatica solutions to improve the quality of information, drive operational efficiency, and make key business decisions faster. eBay is obsessed with Data Quality and Governance, but their engineering team had some challenges using Data Governance at scale. They currently utilize the big data Hadoop platform. In an eBay engineering blog post, Aroop Maliakkal Padmanabhan and Tiffany Nguyen stated:
”In the eBay Hadoop landscape, organizations have their own datasets, which are managed by local data architects working inside their organization, where the governance is mainly on the local level, restricted to the department or only to their organization.”
They wanted to converge these local Data Governance datasets into one single platform and provide a holistic view of the entire platform. They also wanted to unite these silos or the local Data Governance initiatives into one unique place to provide a unified and consolidated view of the data. One of the challenges they mentioned facing was:
“In the Hadoop world, a lot of metadata associated with the datasets gets dropped, making it hard for the data steward to manage all the data in the big data ecosystem. We need to have some kind of self-service capability, where we can socialize some of the governance to end-users.”
They wanted to find a data tagging approach for the enterprise where the metadata that will govern the use of information will be embedded with the data as it passes through various systems in the enterprise. They evaluated a few tools such as Apache Atlas for data tagging capabilities and Apache Ranger for role-based access control on Hadoop.
To solve one of their technical issues, they used something called a hive metastore event listener to prevent any inconsistencies in table metadata on the separate Hive and Atlas clusters.
Conclusion: After the engineers deployed the hive metastore listener, they were able to keep the data definition language (DDL) changes in sync between Hadoop clusters and Atlas. This way, the customers can do tagging, and they can enforce role-based access controls on these tables without any delays.
The second pillar in the high-value big data framework denotes internal competence. Internal competence measures the organization’s readiness and capacity to utilize big data. A competent organization is one who, as a whole, includes an internal culture that is ready to make decisions based on data. Its people are ready to put data into the systems and processes within every arm of the organization and are ready to use big data as a core element to transform the business. This preparedness is a good measure of engagement within the organization.
Engagement
Engagement is the fourth foundation and supports the second pillar of high-value big data framework. These foundations include:
- Usage
- Literacy
- Culture
- Engagement
An organization is engaged when the members’ shared capacity and collective abilities utilize big data. This includes culture, literacy, and education within the organization.
The culture of an organization may be set from the hiring point forward, but from this standpoint, the communication within departments and across the organization is key since data will be used to make decisions and, therefore, communication on how the data will be used and secured is crucial. Communication can be established once all staff is educated on the data and its related projects. Analytical professionals within the organization may take on the role of educating other staff and providing technical support. This means that there needs to be a high level of engagement at the executive level in order to establish a culture within the organization to set data as a core metric for making business decisions.
A good example of this is the wildly successful hedge fund called Bridgewater Associates. Bridgewater Associates’ roughly 1,500 employees abide by a culture of “radical transparency.” According to a Business Insider interview, the founder Ray Dalio has said:
“All meetings are filmed and, with very few exceptions, made available to employees. Employees rate each other’s performance using proprietary iPad apps to publicly display averages in “baseball cards” for each person, and criticizing colleagues behind their backs will get you fired, rather than to their face.”
In an article titled “Employee Engagement 3.0 — From Feedback to Action”, the author Josh Bersin points out that in Ray Dalio’s book Principles (where he talks about why and how he came up with “radical transparency” as a management philosophy), he describes how his company has automated feedback and even measures the “reliability” and “authority” of each person to rate some people more “influential” than others.
So, Bridgewater Associates’ company culture of encouraging people to speak honestly to other employees and telling them about their weaknesses (using feedback data) accomplishes two primary things to help his hedge fund, which has $169 billion assets under management (AUM). First, it weeds out the employees that are uncomfortable with receiving constructive criticism and having their mistakes and weaknesses shown so transparently.
Secondly, the company ends up with a lot of people who leave quickly (25 percent quit within 18 months) and a lot of people who wouldn’t want to work anywhere else. The employees who decide to stay and who end up being successful are people who “like learning more than knowing and recognize that the best learning comes from making mistakes, getting good feedback, and improving as a result of it.” And those who decide to stay do so with an intense “cult-like” dedication to playing their part in founder Ray Dalio’s massive machine.
Business transformation is the foundation that results in the ability to measure the impact and outcome of data-driven projects in the organization.
With all-new technology-driven projects within a growing organization, there are three factors to consider. Organizations must determine whether the technology is:
- Scalable
- Adaptable
- Repeatable
As a company grows, so does the need for technology. As more decisions are made using data, so does the need for more staff and more data-driven projects. The thought process needs to include a data-driven technology that will be easy to scale as well as satisfy the demand within the company and its stakeholders. In this same manner, given that technology changes every day, the organization needs to make sure that the data-driven technology projects will be able to stand the test of time, shifting for the needs of its users as well as through time. Finally, in order for a data-driven project to make sense to a changing and growing organization, it needs to be successfully repeated, especially so that those using it can expect to see the same result and, thereby, determine that the data obtained is consistent.
A great example of a legacy company that is using data-driven technology projects to enhance its business in both business outcomes and customer experience is Starbucks. Recently Starbucks stated in an article titled “AI for Humanity: How Starbucks plans to use technology to nurture the human spirit” that they are launching a technology initiative called Deep Brew. Deep Brew will be ideating and working on a broad suite of AI tools to help elevate every aspect of the business and the in-store and customer experience. This type of AI and automation is not meant to replace humans with robot baristas. Gerri Martin-Flickinger, Starbucks Chief Technology Officer, clarifies:
“[The intent is] to use AI to help do the heavy lifting on processes like inventory, supply chain logistics, and replenishment orders, saving partners time and making sure nobody runs out of Nitro Cold Brew or Banana Nut Bread. AI can help managers predict staffing needs and make schedules. AI can help anticipate equipment maintenance well before an oven or a blender goes on the fritz.”
Kevin Johnson, the latest CEO who replaced the founder, has stated:
“Starbucks, essentially, is a company made up of 32,000 small businesses, each with its own ebb and flow and needs. Every store has its own personality, and every store has its own set of customers and its own set of characteristics, and AI can help us understand those individual store characteristics better. If you try to run one algorithm for all stores, you’ll make progress. That’s kind of what we’re doing now. But to really breakthrough, you have to get down to the individual store level, and making sure we’re making it as easy as possible for each store manager to create the culture and the kind of human connection we aspire for where they are, because when we are able to do that — wow, we are at our best.”
And to help corporate have a more comprehensive understanding of the unique needs of each store, Jon Francis, the company’s Senior Vice President of enterprise analytics, Data Science, research data, and analytics, and his team have spent the past four years since he came to Starbucks analyzing the vast sea of data generated by the company and its customers.
Starbucks is also using data-driven AI technology projects to enhance the customer experience through “radical personalization.” An example of this is by using AI in the Starbucks app or on the drive-thru menu to present customers with thoughtful, personalized choices based on their own preferences (also accounting for things like weather and time of day). With the explosive popularity of mobile ordering and delivery services, Starbucks is looking at how AI can help baristas make beverages in a more productive way that that takes the whole picture into account, thereby, using data to inform decision-making. The article states, “For instance, if a store gets a digital order for four iced lattes, but the customer is still 10 miles away, baristas might make other drinks first.”
All of these innovation experiments and ideas are being born out of the Tryer Center, a space for innovation on the first floor of the company’s headquarters in Seattle. The Tryer Center has become an epicenter for exploring and experimenting with ways technology can make life better for the humans of Starbucks — the partners and customers — which translates to increased brand loyalty and business outcomes. All of their initiatives with automation and AI are being informed and fueled by extensive analysis of their vast amounts of customer and supply chain partner data.
Conclusion
Each year, data analytics is becoming an even more invaluable tool for creating value in a business. By providing a comprehensive view of market conditions, customer needs, and preferences, as well as potential project risks, big data can eliminate the reliance on “gut feel” decision-making. Companies can understand and embrace emerging opportunities and align products and services with changing customer needs, thereby creating additional value for stakeholders in the process. But you may still be reading this and wondering where to start?
The main issue with trying to extract value out of data is that it can be a tedious and sometimes difficult long-term project. This is why we have created a framework as a measurement tool for organizations to utilize as a roadmap to their journey of getting value from data. The idea behind the framework is that it’s not about the end goal; it’s about the journey — getting the proper systems in place and taking it step-by-step.
The framework we have created is a benchmark of best practices for an organization to build a data-driven culture, innovation, and a competitive edge, using data as the core. Its purpose is not to create a line item indicating, “This data is worth x amount of value.” It does not provide a tangible amount. It was created as a roadmap for building a data-driven culture from the ground up, thereby giving you a structure for success.