 Click to learn more about author Gilad David Maayan.
Modern web design is all about responsiveness, meaning the degree to which designers or webmasters optimize web pages for browsing and navigation across a range of different devices. Mobile traffic accounted for 52.64 percent of total online traffic during 2017, and websites that are not responsive are losing their audiences. This statistic is backed up by the fact that 57 percent of internet users wouldn’t recommend a business with a poorly designed mobile website.
The Big Data economy has firmly gripped the world of technology in recent years, with businesses of all sizes gathering lots of fast-moving, voluminous data, which requires special infrastructure to process. Big Data also has the potential to emerge as a new subset of responsive web design, changing the way people interact with websites. Read on to find out more on Big Data’s link with web design responsiveness.
Responsive Images
To fully understand Big Data’s usefulness for responsive design, let’s focus on images. Responsive images are a feature of many modern web pages (for more details on responsive images, see this resource by Cloudinary). These images adjust their size “on-the-fly” to fit the screen dimensions of the device each visitor browses a website on.
Not only do they adjust their size, but responsive images adjust their quality based on device resolutions to avoid wasting bandwidth by serving high-quality images to devices that cannot take advantage of them.
Data Visualization
Data Visualization is the representation of information/data in charts, diagrams, figures, and graphs, etc. When organizations gather Big Data, they typically look for ways to derive insights, predictions, or some other form of value from all that information.
Another use case for Big Data has emerged in the realm of responsive Data Visualization. Enterprises are starting to realize that they can use Big Data by presenting it visually to website visitors. The presentation of the data follows responsive design principles, so that the visualizations appear and behave the same way, regardless of the device used to view them.
Interactive Data
Scalable vector graphics have played a pivotal role in the ability to responsively serve Data Visualizations that users can interact with. Presenting Big Data in older static image formats is not the most exciting use case and nor is it practical to sow anything interesting with such voluminous high-velocity data packed into a still image.
Alongside SVGs, website designers can use modern web design techniques like Ajax, HTML5, and CSS to build dynamic, on-page Data Visualizations that users can interact with. The SVGs facilitate lightweight use of Big Data while Ajax calls negate the need for page refreshes. HTML and CSS help with the presentation. All of this leads to a Big Data Visualization approach that follows the principles of responsive web design.
Tell Stories
The real evidence for how Big Data can help responsive web design can be viewed by assessing its impact on end user experience for website visitors. The main idea is to use the Big Data to tell multiple stories by presenting it visually, responsively, and interactively, letting users decipher their own unique meaning from the data.
People can discover their own stories from within the Data Visualizations by manipulating sliders or pressing buttons. Because Big Data sets can contain lots of irrelevant information, part of the skill of presenting this data to end users is to focus on aspects of the datasets that are likely to resonate with people.
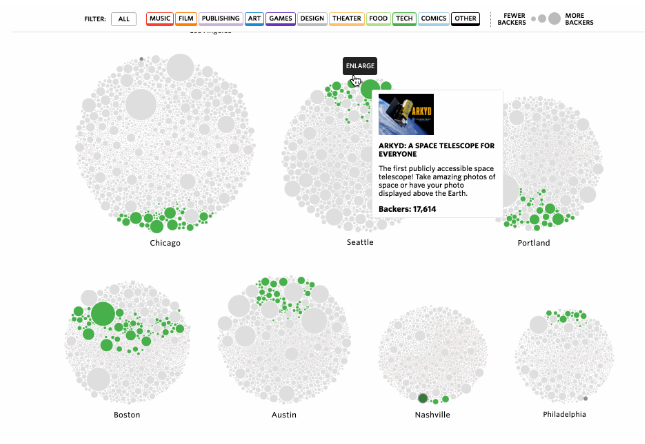
The above graph by Polygraph shows the entire history of Kickstarter projects broken down by U.S. city. The interactive visualization allows users to derive their own meaning from it by choosing from categories like music, film, art, and games.
Real-Time Information
A particularly amazing example of how Big Data and responsive design can complement each other is evident in the TRAVIC (Transit Visualization Client) web application. This service aggregates and interpolates public transport schedule data from many countries to provide real-time information on the locations of trains and buses, making it much easier for people to plan their journeys and precisely time transport services.

Wrap Up
In much the same way that companies like to explore Big Data for meaning, users can get insights too when the companies that gather all this data figure out data points relevant to end users, and follow responsive design principles to display information in a user-friendly, interactive way. Furthermore, Big Data can enhance web application functionality, with real-time streaming data used to visually display information on transport services, weather, etc.
Photo Credit: Pixabay