
Click to learn more about co-author Maarit Widmann.
Click to learn more about co-author Alfredo Roccato.
Wheeling like a hamster in the Data Science cycle? Don’t know when to stop training your model?
Model evaluation is an important part of a Data Science project and it’s exactly this part that quantifies how good your model is, how much it has improved from the previous version, how much better it is than your colleague’s model, and how much room for improvement there still is.
In this series of posts, we review different scoring metrics: for classification, numeric prediction, unbalanced datasets, and other similar more or less challenging model evaluation problems.

Today: Penalizing and Rewarding Classification Results with a Profit Matrix
Confusion matrix and class statistics summarize the performance of a classification model: the actual and predicted target class distribution, accuracy of the assignment into the positive class, and the ability to detect the positive class events. However, these statistics do not consider the cost of a mistake, that is, a prediction into the wrong target class.
If the target class distribution is unbalanced, predicting events correctly into the minority class requires high model performance, whereas predicting events into the majority class can easily happen by chance. Wouldn’t it be useful to take this into account, and weight the results differently when evaluating the model performance?
Ultimately, the final goal of the classification determines whether it makes sense to introduce a cost to certain types of classification results. Cost is useful when incorrect predictions into one target class have more serious consequences than incorrect predictions into the other class(es). Or, put another way, correct predictions into one class have more favorable consequences than correct predictions into the other class(es). For example, not detecting a criminal passenger at the airport security control has more serious consequences than mistakenly classifying a non-threatening passenger as dangerous. Therefore, these two types of incorrect predictions should be weighted differently. No cost is needed if all target classes are equally interesting or important, and the consequences of a wrong prediction into one target class is as bad as it is for the other classes. This is the case when we predict the color of a wine, for example, or the gender of a customer.
From Model Accuracy to Expected Profit
In addition to accuracy statistics, the performance of a classification model can be measured by expected profit. The profit is measured in a concrete unit defined by the final goal of the classification.
When we use classification results in practice, we assign each predicted class a different treatment: Criminal passengers are arrested, non-threatening passengers are let through. Risky customers are not extended credit, creditworthy customers are! And so on. The most desirable classification results produce profit, such as the security of an airport, or the money that a credit institute makes. We measure this profit in a predefined unit such as the number of days without a terror alarm, or euros. The most undesirable results bring about cost – a terror alarm at the airport, or money lost by a bank – and we measure the cost in the same unit as the profit.
Here, we assess the accuracy and expected profit of a classification model that predicts the creditworthiness of credit applicants. In a credit scoring application, predicting individual customer behavior has a consequence in terms of profit (or loss). Refusing good credit can cause loss of profit margins (commercial risk). Approving credit for high risk applicants can lead to bad debts (credit risk).
Optimizing Classification Threshold
A classification model predicts a positive class score for each event in the data. By default the events are assigned to the positive class if their score is higher than 0.5, and otherwise to the negative class. If we change the classification threshold, we change the assignment to the positive and negative class. Consequently, the values of accuracy and expected profit change as well.
The Data
In this example, we use the well-known German Credit Data Set, as taken from the University of California Archive for Machine Learning and Intelligent Systems.
The dataset is composed of 1000 customers. The input variables are the individual characteristics of the subjects, like socio-demographic, financial and personal, as well as those related to the loan, such as the loan amount, the purpose of the subscription, and wealth indicators. The target is the evaluation of the credit applicant’s creditability by the bank (2 = risky, and 1 = creditworthy).
In this dataset, 700 applicants (70%) are classified as creditworthy and 300 (30%) as risky.
We refer to the risky customers as the positive class and the creditworthy customers as the negative class.
Workflow to Produce Expected Profit for Different Classification Thresholds
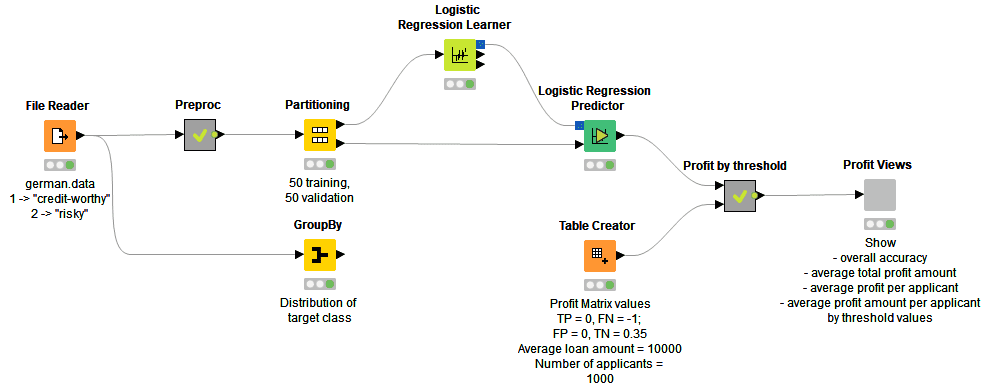
The workflow shown in Figure 1 starts with data access and preprocessing. To assess the predictive capabilities of the model, the initial dataset is divided into two tables of equal size, respectively named the training set and the validation set. Next, a logistic regression model is trained on the training set to predict the applicants’ creditworthiness.
Inside the “Profit by threshold” metanode, applicants in the validation set are assigned to the two creditability classes “risky” and “creditworthy” based on the positive class scores that are predicted by the logistic regression model, and a classification threshold. The classification is repeated multiple times, starting with a low value of the threshold and increasing it for each iteration. The output table of the metanode contains the accuracy statistics and expected profit as obtained using the different threshold values and a predefined profit matrix.
Finally, the model performance statistics for different threshold values are shown in an interactive composite view as produced by the “Profit Views” component.
You can download this workflow from the:
- Hub
- EXAMPLES Server (EXAMPLES/04_Analytics/10_Scoring/02_Optimizing_Classification_Threshold_Based_on_Profit)
Profit Matrix
To evaluate misclassification in terms of expected profit, a profit matrix is requested for assigning cost to undesirable outcomes.
We introduce a negative cost (-1) to the False Negatives – risky applicants who are approved a credit – and a positive profit (0.35) to the True Negatives – creditworthy applicants who are approved a credit. The profit matrix in Table 1 shows the cost and profit values for these classification results.
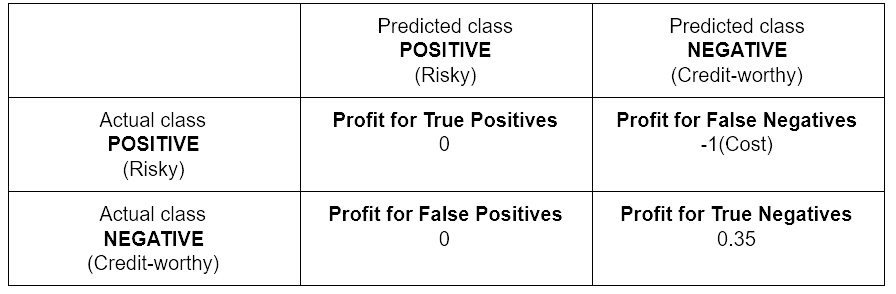
The values of cost and profit introduced in Table 1 are based on the following hypothesis [1]: Let’s assume that a correct decision of the bank would result in 35% profit at the end of a specific period, say 3-5 years. If the opposite were true, i.e. the bank predicts that the applicant is creditworthy, but it turns out to be bad credit, then the loss is 100%.
Calculating Expected Profit
The following formulas are used to report the model performance in terms of expected profit:

Where p is the share of the positive (risky) class events of all data.

Where n is the number of credit applicants. More generally, assuming that the class with negative risk potential is defined as the positive class, an average profit for a classification model with a profit matrix can be calculated using the following formula:

Where n is the number of events in the data. In this example, we have 500 credit applicants in the validation set with an average loan of 10 000 €. 70% of the applicants are creditworthy and 30% are risky. Let’s first calculate a baseline for the profit statistics without using any classification model:

If we approve a credit for all of the applicants, the expected loss is 225,000 €.
Next, let’s calculate what the expected profit is when we evaluate the creditworthiness using a classification model and we weigh the outcomes with the profit matrix.
The minimum threshold for the positive class to achieve non-zero profit [2] can be calculated from the cost matrix as:

This value can be adjusted empirically as described below.
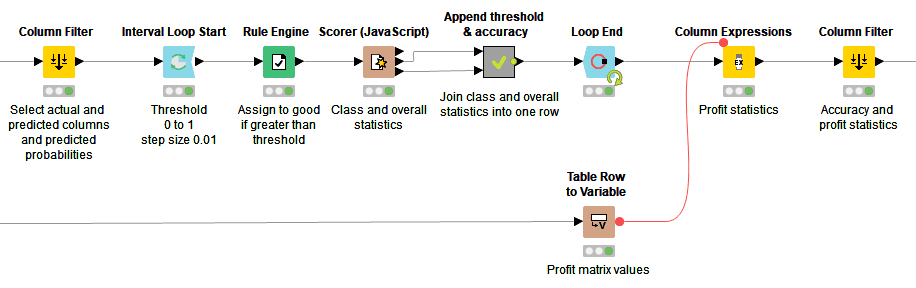
The workflow shown in Figure 2 iterates over different thresholds to the positive class scores that have been predicted by a classification model, here a logistic regression model. The threshold values range from 0 to 1 with a step size of 0.01. The workflow produces the overall accuracy for each value of the threshold by comparing the actual (unaltered in each iteration) and predicted (altered in each iteration) target class values. In order to calculate the expected profit, classification results from each iteration are weighted by the values in the profit matrix. In the output table of this workflow, every row corresponds to a value of the classification threshold, furthermore, the model accuracy statistics, average profit per applicant, average amount per applicant, and total average amount are shown for each classification threshold.
The Results
The interactive composite view in Figure 3 shows how the values of four different model performance indicators develop if the value of the classification threshold increases from 0 to 1. The performance indicators are: 1. Overall accuracy (line plot in the top left corner) 2. Total average amount (line plot in the top right corner), 3. Average profit per applicant (line plot in the bottom left corner), and 4. Average amount per applicant (line plot in the bottom right corner).
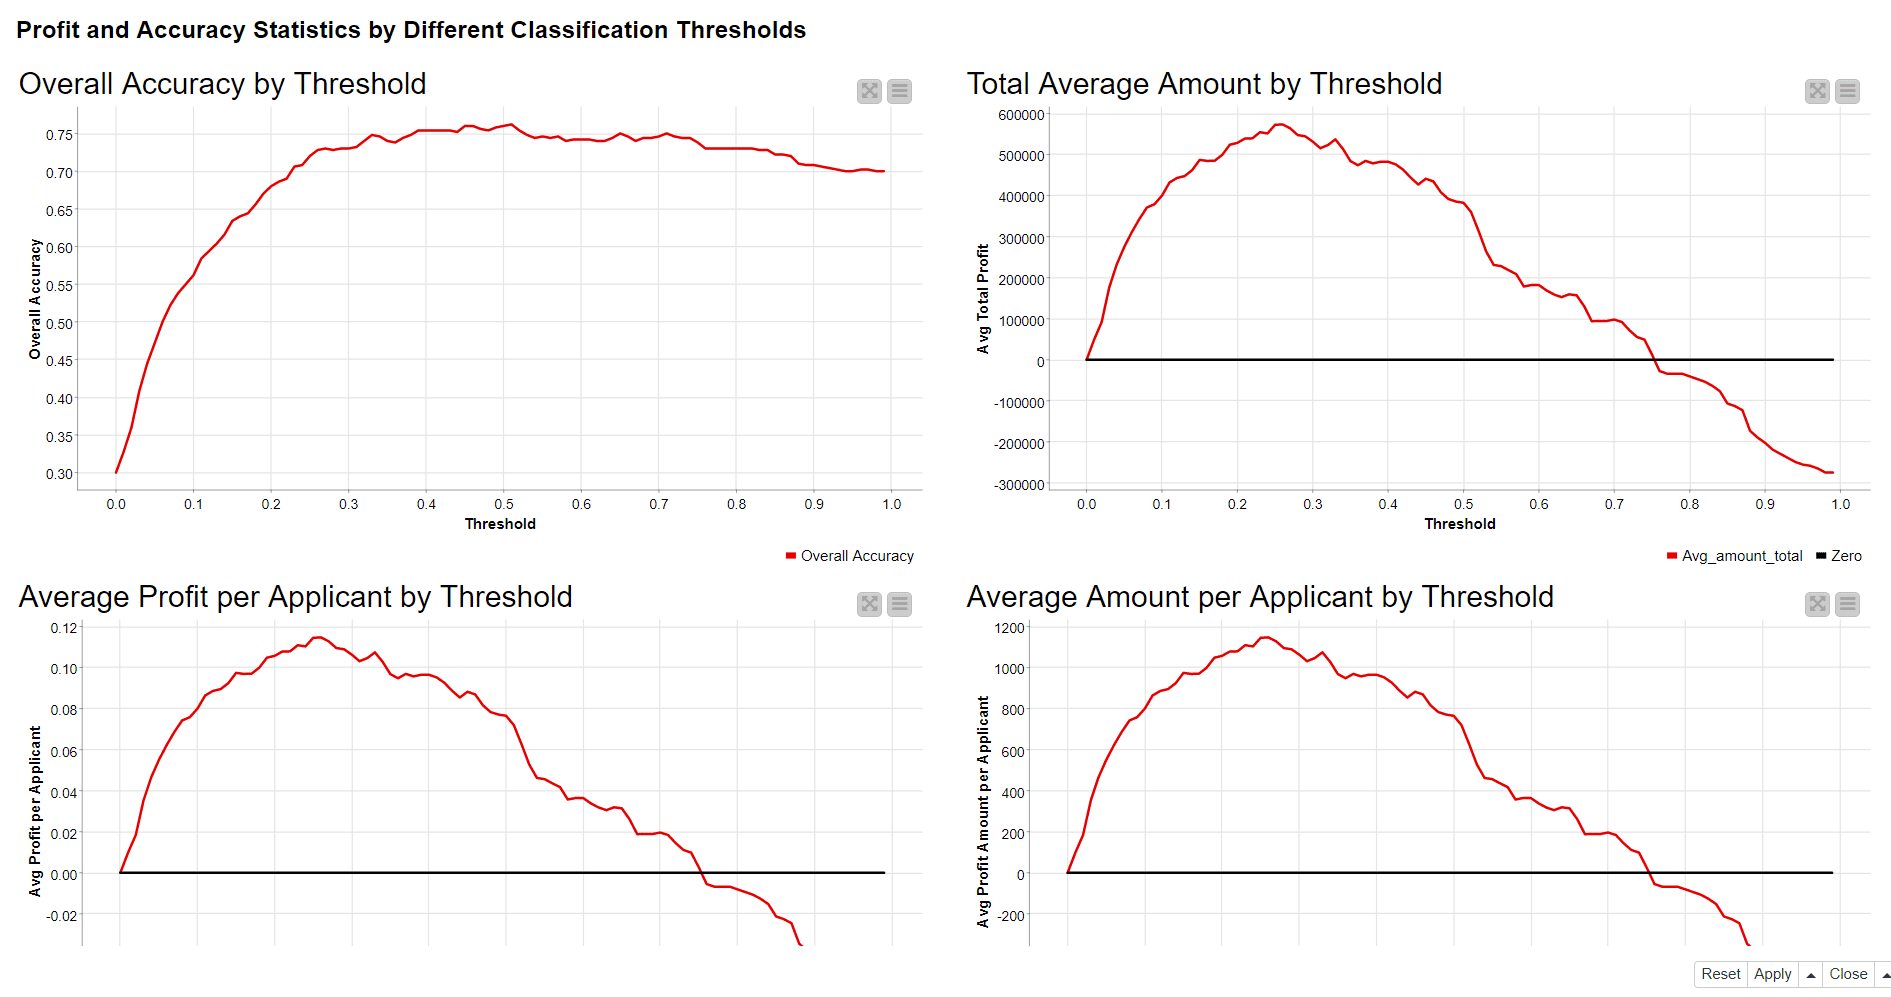
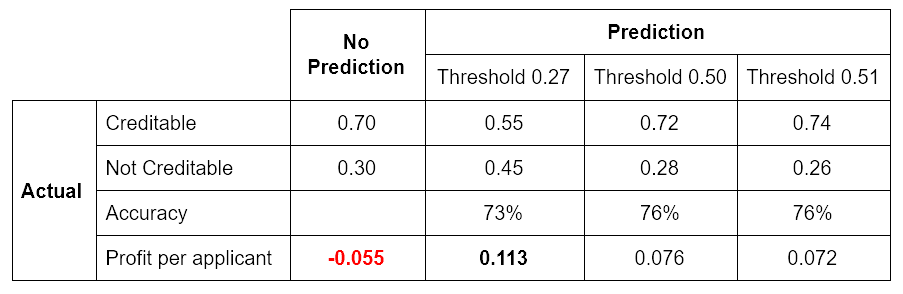
Based on an empirical evaluation, the optimal threshold is 0.51 in terms of overall accuracy, and 0.27 in terms of expected profit. Table 2 represents the performance of the logistic regression model using the default and optimized threshold values in terms of overall accuracy and average profit per applicant:
References
[1] Wang, C., & Zhuravlev, M. An analysis of profit and customer satisfaction in consumer finance. Case Studies In Business, Industry And Government Statistics, 2(2), pages 147-156, 2014.
[2] C. Elkan. The foundations of cost-sensitive learning. In Proceedings of the Seventeenth International Joint Conference on Artificial Intelligence, pages 973-978, 2001.