Click to learn more about author Thomas Frisendal.
When you face highly connected data, you might have to choose between Relational vs. Graph. Which one is better? The answers became clear to me, when I asked people from both camps using two (non-scientific) questionnaires. It is not rocket science, but you still need to do some simple math: You have to count types and relationships and look at the distributions of the membership counts.
How High is “A High degree of Connectedness”?
First and foremost, I was interested in answering the question:
“Is connectedness in relational databases significantly lower than in graph databases?”
There is reason to assume this, because foreign key relationships in SQL can seriously threaten your performance (in the database).
The 24 people, who helped me (8 “graphistas” from the Neo4j community and 16 mostly relational people), provided information about both Data Modeling methodology and database complexity. A big hand to all of them for sharing the information with us.
Disclaimer: This is not pretending to be precise science, I am just trying to get a rough, but empirical, picture.
I also threw in some profiling of 3 publicly available databases on the graph side (available on Neo4j’s web site):
- The famous Panama Papers database (1.040.000 nodes of 4 types and 1.500.000 relationships of 284 types)
- A US Congress legislation database (12.000 nodes of 8 types and 300.000 relationships of 9 types, based on govtrack.us data)
- An IT network management database (80.000 nodes of 17 types and 180.000 relationships of 12 types)
Relational Database Connectedness
The relational observations are based on appr. 22000 production tables on 16 sites. The most important measure is the number of relationships compared to the number of tables. The key question used in the survey was this:
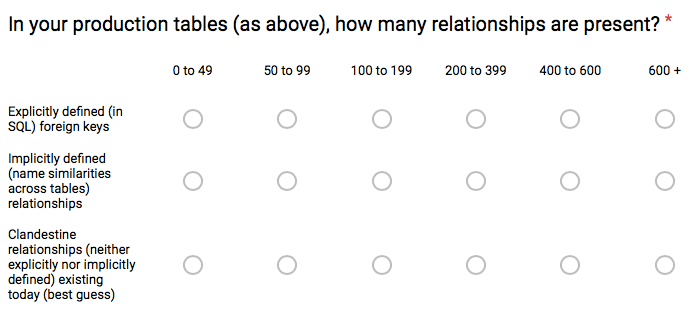
Having been around in many a database, I know that many data modelers and DBAs often are looking like Scrooge McDuck and are greedy misers (but with good reasons), when it comes to spending resources on physical relationships. Therefore, we are looking for not only explicitly defined (foreign key) relationships, but also:
- “Implicitly defined” by way of having e.g. name similarities across tables, but not having materialized the relationship with a foreign key, and also
- “Clandestine” relationships, which exist data content-wise and thus maybe could have been materialized.
The implicitly-only relationships may possibly have been sacrificed on the performance altar, whereas the clandestine relationships may not have had any immediate business relevance (at the point of design time).
And the results are here (in relative terms):
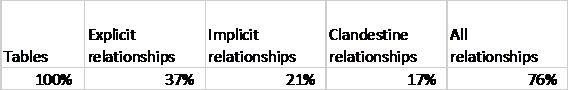
So, for every table, there is an average of 0.76 relationships, but only 0.37 of them are explicitly declared:
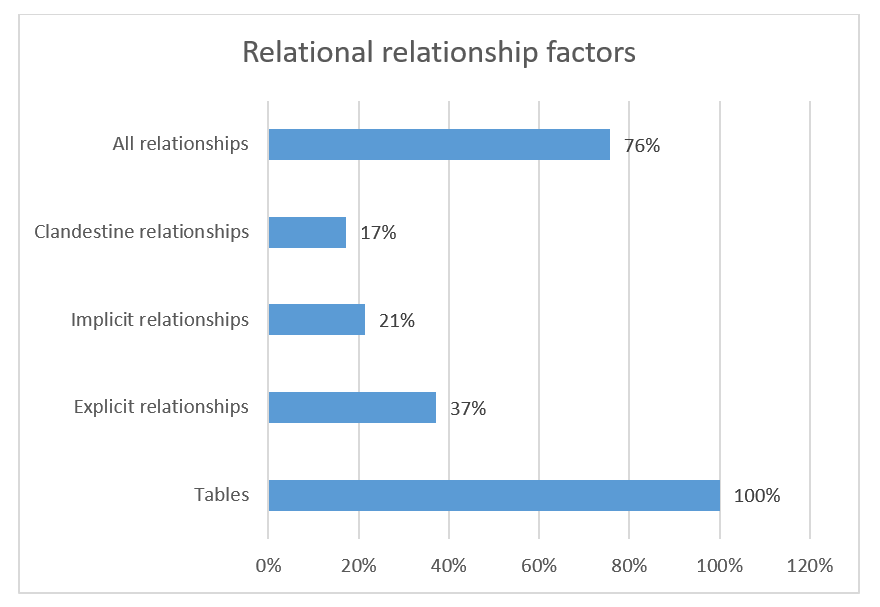
Since the implicit relationships are more or less well known, there is an unrealized 36 % of all known relationships, which are not explicitly supported by the data model. Even given that we still only see around half a relationship per table. Not at impressing figure for connectedness.
However, I am not surprised, this confirms my experiences from many of the SQL data bases that I have seen over the many years at many sites. One thing is that there are probably a whole lot of indexes out there, which could have been declared as being relationships proper.
And that is what would happen in a graph database.
Graph Database Connectedness
Moving to the graph observations. 8 people tending 2850 labeled node types responded:

In rough numbers, the connectedness is almost 2-3 times as high as in the relational responses.
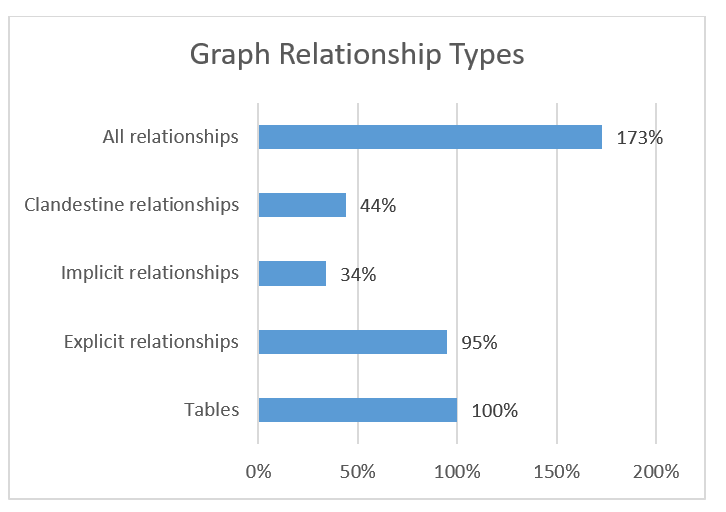
But be careful out there: The average of roughly 2 relationship (instances) per node (instance) is not that high. The catch is, that the distribution of relationship occurrences might well be seriously skewed.
So, when throwing in the 3 publicly available graph databases mentioned earlier, I could profile those data, and my results illustrate the skew quite clearly.
First, let’s look at the data models. Neo4j contains a schema profiling function that can tell you what the schema found in the actual data content looks like. Using that, here follows the IT Network Management database that you can play with on Neo4j’s website:
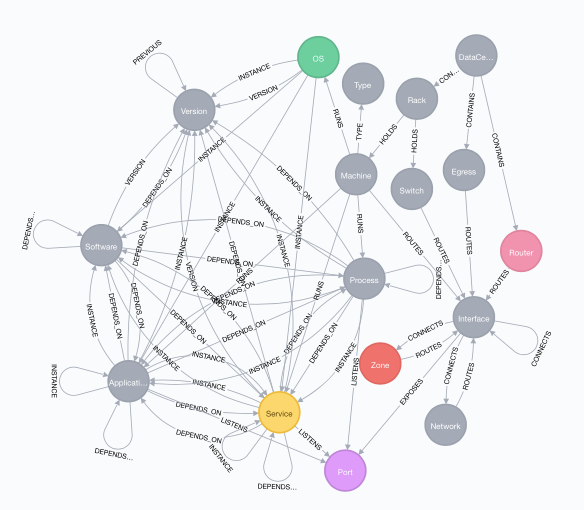
Not the most complicated data model in the world. But notice that even though there are only 12 types of relationships, some of them are used in multiple contexts (like e.g. “ROUTES” and “DEPENDS_ON”).
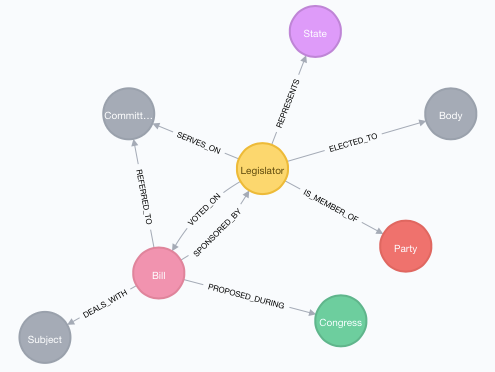
The govtrack.us derived graph data base model is nice and simple, and it looks like this:
And, finally, the Panama Papers data model looks like this:
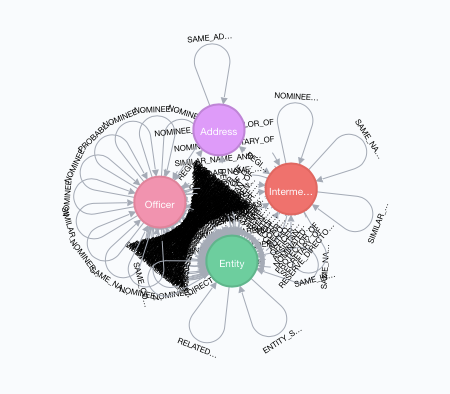
Wowee, that is connectedness of the third degree! The big black blob in the middle are the relationships between Officers and Entities. There are over 200 different types of them. Could have been modeled differently, but this works.
What we want to know more about is:
- Number of node types (a labeled node type is roughly similar to a table type) and relationship types
- The factor of relationship types per node type
- The distribution of relationship type cardinalities:
- Minimum (if = 0 then some nodes are unconnected with respect to that relationship type)
- Average
- Maximum
- The actual number of node and relationships instances.
Doing some data profiling (using the Neo4j default profiling scripts), here is what we see:
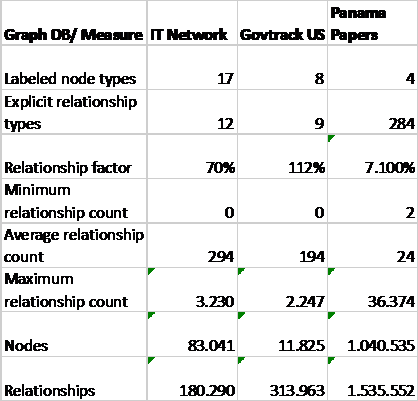
The IT Network database (network management focus) and the Legislation database (based on Govtrack.us) are looking, at first sight, like rather peaceful and quiet databases. The devil is in the detail: The distribution spread goes from 0 to 294 on the average and a maximum of 3230 relationships to / from one node in the IT network, and the skewness peeks in the Panama Papers with a maximum count of 36374!
The Panama Papers were built mostly from text mining etc., and they might be considered special in that they are highly connected. There are many actors and some key actors are intermediaries in a big web.
But wait a minute: Cannot that also be said of many other connected data. What about social networks and also financial portfolios and funds? Even plain enterprise knowledge graphs with actors inside the company, with suppliers, with customers, buying products, in stores, over the geography etc. can also be highly connected, and the distribution of relationship instances can be somewhat skewed.
The surveys also looked into various Data Modeling practices, so let’s have a look at those.
Relationships Should not be Stepchildren!
But they often are. It seems as if (too) many people care less for them, than they do for their nodes / tables.
I asked some detailed questions about some things, but there is not enough significance in the amount of responses. Instead of quantifiable results, here follow some observations:
Relational Camp
Data Modeling is done by data modelers (obviously), but also by some data architects and business analysts.
All of the respondents have 10+ years of experience with Data Modeling. (Yes, we do, don’t we, all of us)!
A variety of modeling tools are used.
Almost everyone is permitted to define constraints on foreign keys. Can be bad for your performance, you know.
30% responded that Data Modeling was done by 10+ people in the organization. That is definitely not so on the graph side.
Graph Camp
Only 1 of the respondents had 10+ years of experience. The rest had 5 years or less.
All of them did the Graph Modeling themselves. (And as some of you know, the schema is frequently looked at late in the graph DB creation workflow.
There different styles of using labels. Sometimes unlabeled nodes occur, and on the other end, sometimes nodes with more than one label are frequent.
(Note to people not that familiar with labeled property graphs: Labels are “stamps”, most often used for categorizing (typing) the node. Sometimes it can come in handy to reflect e.g. subtypes with additional labels.)
So far so good.
One thing is very important to me, and that is the issue of naming the relationship types appropriately. (Even stepchildren deserve nice names).
Why then, do many people pay little attention to relationship names?
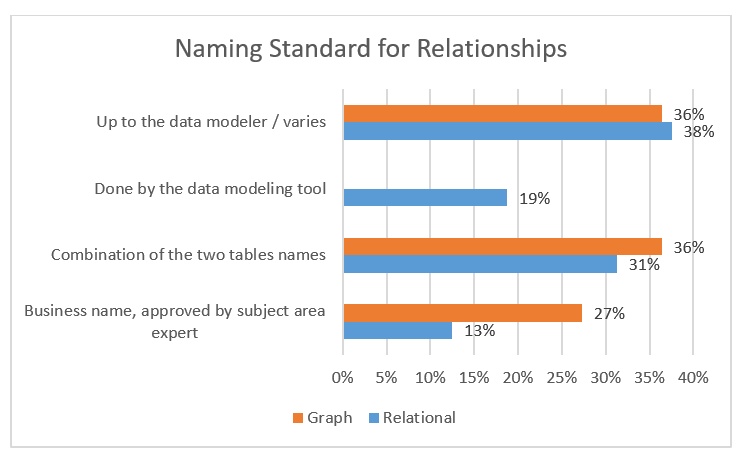
Business names is the way to go. The combination of two table/node names is seldom useful. What about “Address-Order”? Could be Shipping Address, Invoice Address or many other business meanings. Combining the two table names is what most Data Modeling tools do by default. Good to see that the graph people are better at using business names than the relational guys.
Here is What We Have Learned
Meaning is still important, and the most important part of that is to be meaningful in the business context.
Ironically enough, the challenge of relational databases is relationships.
Structure is important, and as the big world of data gets more and more connected, those real limitations of relational are becoming more and more obvious, as demonstrated above
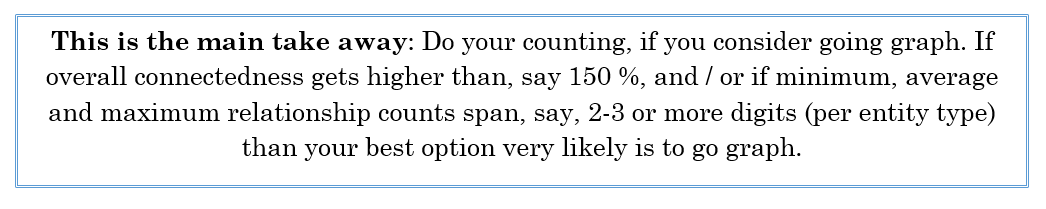
It is now easier to give a qualified recommendation about when to go the graph way:
“When structure is a challenge, count the nodes and the relationships, look for skewed distributions and let the numbers speak”
Thank you very much all of you, who participated in the surveys! Much appreciated!
Feedback is also welcomed – use info@graphdatamodeling.com.