
Click to learn more about author Steve Miller.
In my many years as a data scientist, I’ve spent more time doing forecast work than any other type of predictive modeling. Often as not, the work’s involved forecasting demand for an organization’s many products/lines of business a year or more out based on five or more years of actual data, generally of daily granularity. A challenge indeed and one for which accuracy expectations by the business are seldom met.
One thing I’ve learned about forecasting is not to be a slave to any modeling technique, choosing predictive integrity over model fidelity. And I’ve become adept at scrambling — adapting to early forecasting results with appropriate model changes to better predict an ever-evolving future. It turns out that both economists and meteorologists are also in that mode, with a name, “nowcasting”, to describe how they modify early forecasts based on experience during the forecast period. Meteorologists are constantly changing their weather forecasts, and economists update their annual GDP projections quite often as a consequence of evolving inputs.
Formally, nowcasting is the “prediction of the present, the very near future and the very recent past. Crucial in this process is to use timely monthly information in order to nowcast key economic variables…..the nowcasting process goes beyond the simple production of an early estimate as it essentially requires the assessment of the impact of new data on the subsequent forecast revisions for the target variable.”
I’ve written several blogs for DATAVERSITY on crime in my home city of Chicago, especially after the disturbing uptrend in 2016. I continue to download Chicago crime data daily to look at the frequencies of homicides and violent crimes. The trends are in the right direction, though the pace is not nearly fast enough.
After the disastrous 2016, I’ve been in forecast mode for 2017, 2018, and now 2019. My approach is one of nowcasting — starting with predictions for 2019 based on the available data from 2001-2018, then changing these forecasts based on the daily experience as 2019 progresses. It turns out, not surprisingly, that using year-to-date experience is very helpful in forecasting final annual counts. Knowing the number of violent crimes between 1/1/2018 and 1/31/2018 is a big help in predicting the final 2018 violent crime frequencies. And knowing the counts through 6/30/2018 is even more valuable.
The remainder of this blog examines how the first quarter crime counts for homicide and violent crimes can assist in forecasting final annual numbers. I explore the relationships between year-to-date and final counts for homicides and violent crimes in Chicago from 2001-2018, then attempt to forecast 2019’s final counts. I’ll continue to do the analytics as 2019 progresses, hopefully nowcasting more accurate (and declining) counts over time.
The technology used is Jupyter Notebook and the R statistical package. The cumulative daily Chicago crime file from 2001 through to-date 2019 (a week in arears) drives the analysis.
The computational steps supporting the nowcasting “forecasts” of 2019 Chicago crime include:
1) downloading/reading the daily-updated data from a City of Chicago website into an R data.table.
2) enhancing said data with supplemental crime and geography dimension descriptions, saving the resulting data.table to the lean, fast-access fst format.
3) implementing a general-purpose frequencies procedure that can both filter and quickly yield multi-dimensional frequency counts on R data.tables attributes.
4) from the above, wrangling homicide and violent crime data.tables that join yearsofar with annual crime counts for each of the years 2001-2018.
5) using the 2001-2018 data to relate yearsofar with annual figures, first graphically exploring and then predicting the unknown 2019 annual from the known 2019 yearsofar.
6) the nowcast predictions will change with each day’s new data. as we progress deeper into the year, yearsofar will begin to track the annual quite closely.
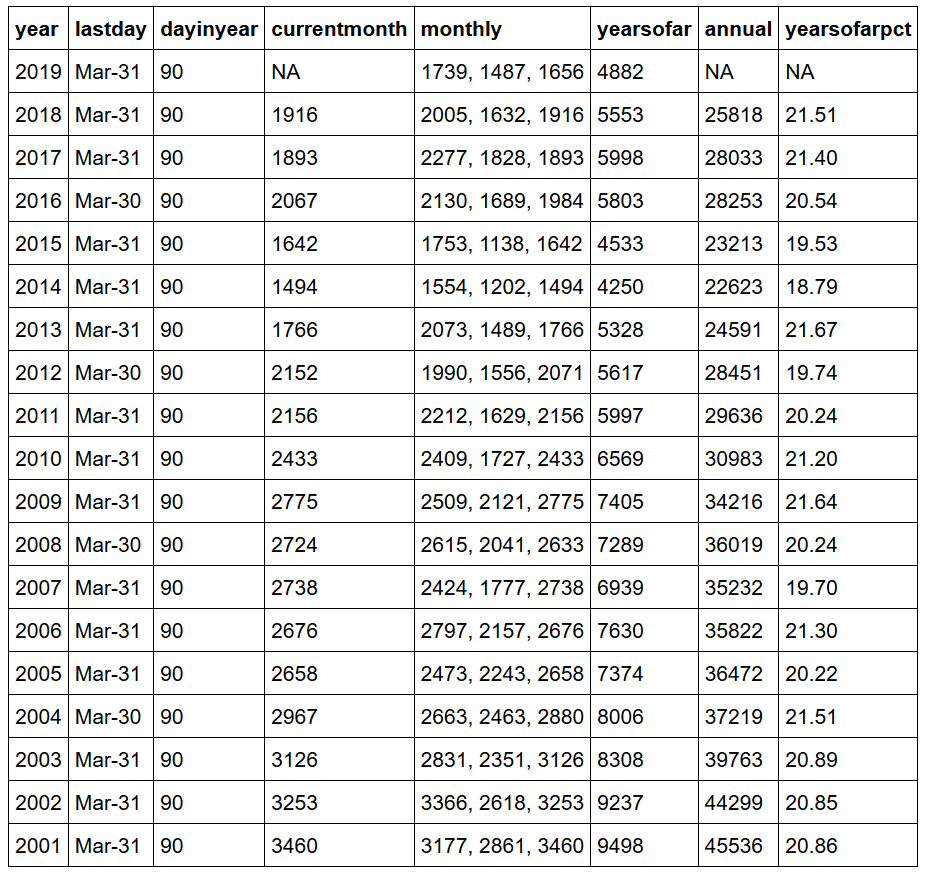
First consider homicides. In the most recent run, the data combine the first 90 days of each year with annual figures for 2001-2018. The 90th day is either Mar-31 or Mar-30, depending on leap year status. The monthly attribute details frequencies by month to the last day of consideration. yearsofar represents the total as of the 90th day, while annual is the final yearly figure for each of 2001-2018, with 2019 obviously unknown. The nowcasting approach is to relate yearsofar with annual for 2001-2018, then to use 2019 yearsofar to predict 2019 annual. yearsofar will become a better predictor of annual as 2019 progresses. Note that yearsofar 2019 is continuing a welcome downward trend from 2016.

Violent crime is likewise on a downward trajectory from the tragic peak in 2016. The higher volume of vc’s compared to homicides make for more stable calculations.
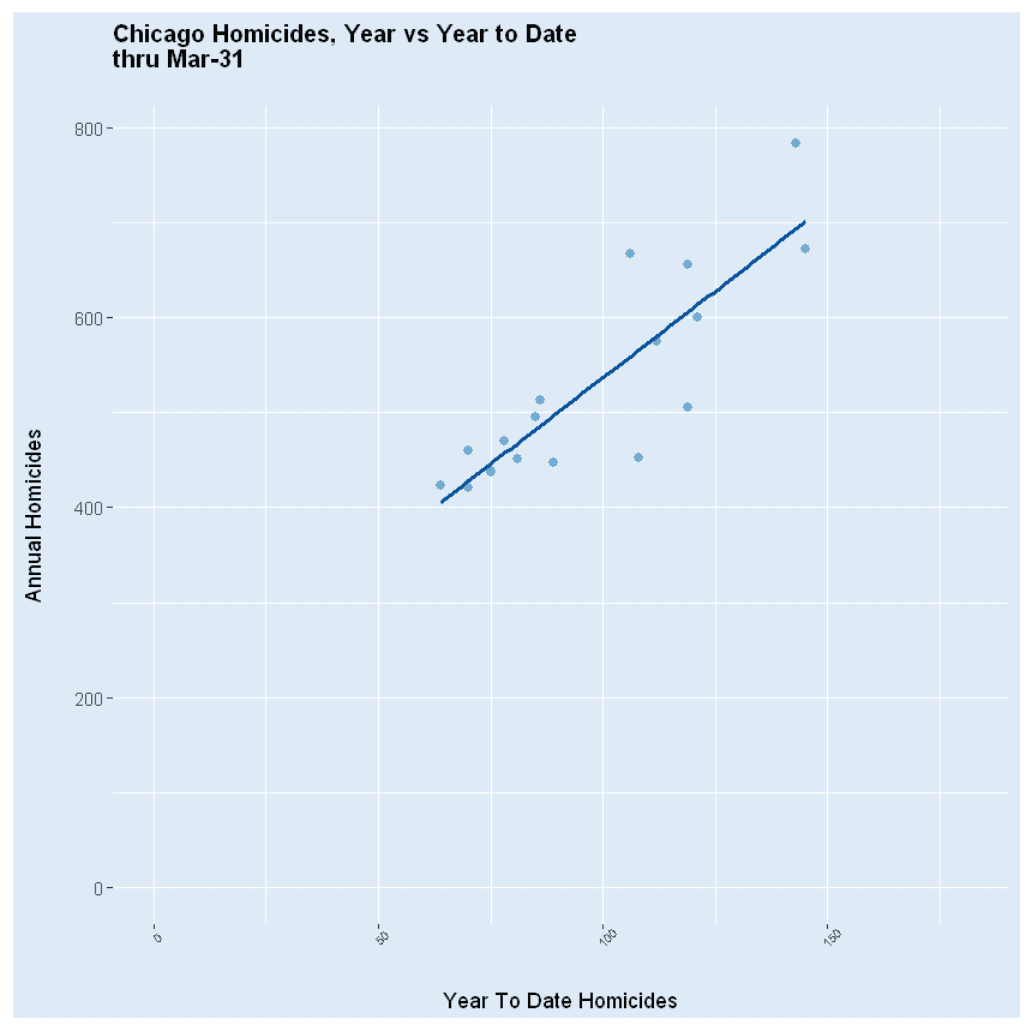
Now visualize homicide yearsofar against annual for 2001-2018. Though the relationship is clearly positive increasing, the linear correspondence is much tighter at lower values of yearsofar than higher ones, suggesting heteroscedasticity. The good news for the 2019 annual prediction is that 2019 yearsofar is low.
Next look at the 2001-2018 relationship between annual and yearsofar violent crimes as of Mar-31. This correspondence is more confidently linear, positive, and tight.

Simultaneously, visually track yearsofar and annual homicides for 2001-2019, using a Poisson regression prediction of 451 homicides for 2019. Note, unsurprisingly, how annual tracks yearsofar. This relationship will get stronger as 2019 progresses.

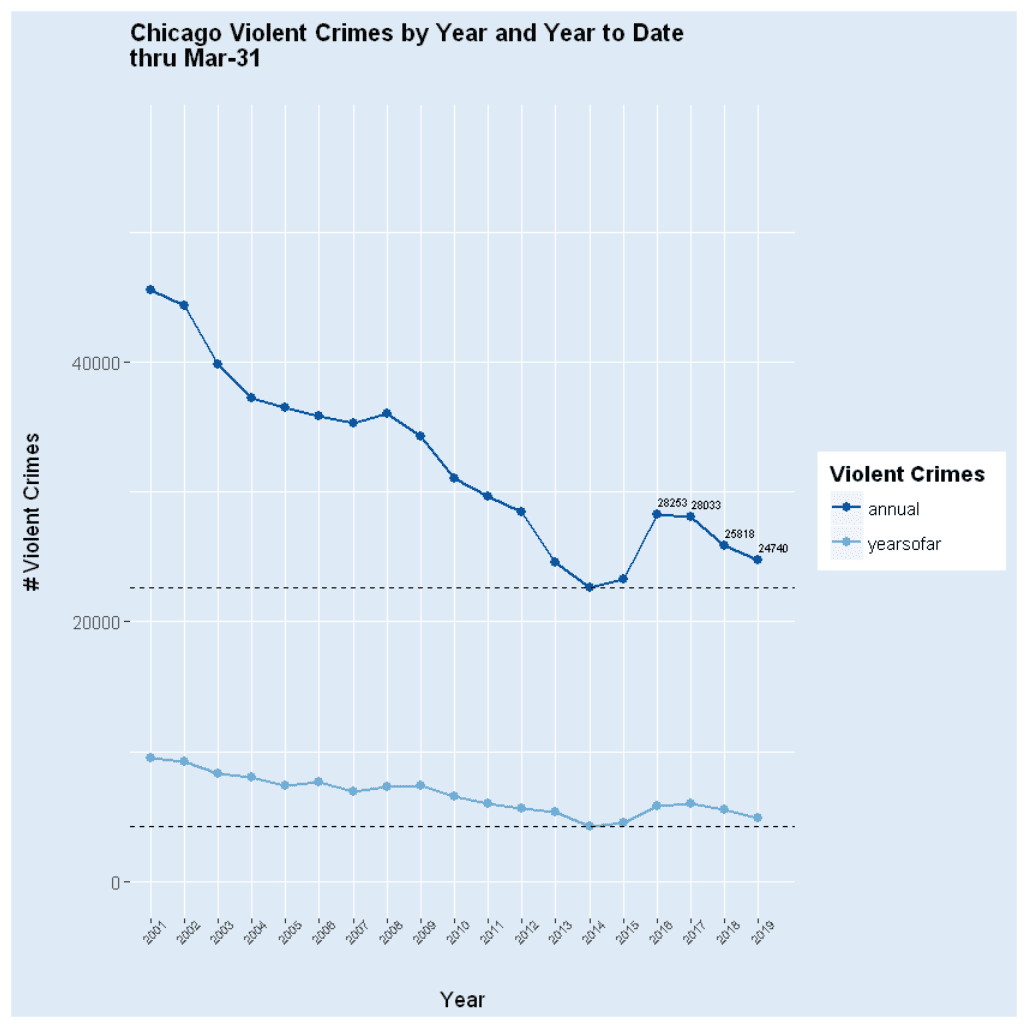
Ditto for violent crimes, where the direction is again headed down as it was in 2001-2014. This is a good sign. The nowcast, Poisson regression, 2019 annual forecast is 24,740 violent crimes as of data from Mar-31.
Chicago remains a violent city, but the downward trends in crime following a disturbing 2016 are encouraging. I’m hopeful that rates in the city will decline beyond historical lows in the next few years — and then start to approach those of safer peer cities. Chicago can do it!