Click here to learn more about author Sakthi Rangarajan.
The mining industry has been hit hard in recent years by uncertain metal prices and increasing commodity costs. Experts are predicting that the prices of key commodities like energy, tires, trucks, cement, grinding media will continue to grow and the metal prices will continue to be shaky as the world economy is going through bumpy times. The below chart shows how the price of key commodities used in mining is going up over the past decade.
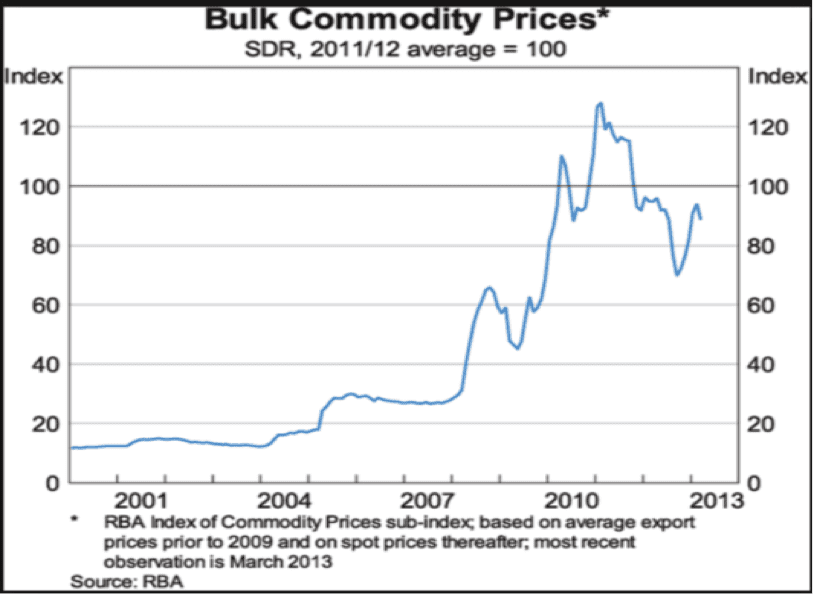
Source: Reserve Bank of Australia. 2013. “The Outlook for Business Investment in Australia” (accessed 8/26/2016)
High cost of the operations and a sluggish global economy has made cost savings a top priority for the executive leadership team. As supply chain manages the contracts with vendors and the purchase of goods and services, supply chain stands in the fore front in bringing in cost savings for any mining company. A large global gold mining company faced similar challenges and the supply chain function was tasked with delivering millions of dollars in savings and also to bring transparency and controls to the dollars spent on goods and services. The key IT capability the business leveraged to achieve the goals is the Enterprise Data Warehouse (EDW). In this company, the EDW was built on a Teradata database, the EDW architecture was in third normal form and then denormalized to satisfy reporting requirements. Reporting environment was setup using SAP Business Objects and ETL tool was SAP Data Services. The source systems are SAP ECC and legacy ERP systems. In the below sections, I am going to discuss the details on how EDW was leveraged to deliver two critical supply chain business goals.
Spend Management
As stated above, supply chain manages huge dollar amounts in the mining industry. The spend amount is usually in billions of dollars in global mining firms. Spend data is critical for supply chain and the issue this specific organization faced was the lack of details and transparency of the spend data. The end users were able to query spend data from EDW but it was hard to get to the details (the who, what, when and how). It was nearly impossible to slice and dice the information in an intuitive way. A decision was made to improve transparency to spend data and also enrich the same with details. Who is better suited than EDW to help here?
Supply Chain analysts and leadership wanted to answer the below questions without jumping through hoops:
➢ Where is the money being spent from?
➢ What is the money spent on?
➢ Who are we paying?
➢ Who is responsible for the spend?
➢ When was it spent on?
➢ Were the right processes used?
➢ How to easily get historic spend data for intelligent negotiations?
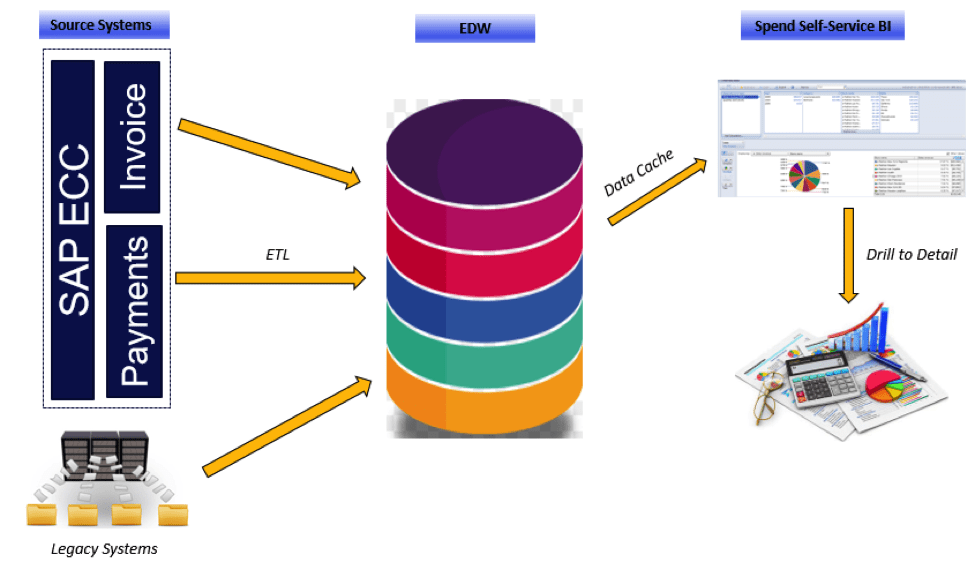
The challenge the Enterprise Data Warehouse team faced was that the spend details came from multiple subject areas. The data team conducted many workshops with the supply chain spend analysts team and identified all the integration and allocation rules. Data from the different subject areas (mainly Accounting and Procure to Pay) were integrated based on the identified rules and a spend data mart was built. The data mart, in star schema, had all the details of the spend dollars along with all the possible dimensions to slice and dice the spend data.
An innovative slice/dice visualization solution using SAP Business Objects Explorer and Web Intelligence was delivered. The Explorer solution is a self-service solution where the spend data (excluding the document level details) was cached every day and the business users were able to perform intuitive analysis on the cached data (like a dashboard but not exactly). From the Explorer analysis area, users can select the criteria they are interested in and can go straight to Web Intelligence (the business objects ad hoc querying tool) to get the document level details for the selection criteria. This enable the concept of starting the analysis at a summary level, identifying the trends, questions and then drilling down to the details. This was received by the business users extremely warmly and was soon adopted as the one stop shop for all spend analysis. By one estimate, this solution increased savings in total spend by 2 % per annum, which is equivalent to hundreds of millions as we are talking about billions of dollars in spend. Here is a high level solution diagram.
Savings Management
The supply chain organization was centrally managed from the global headquarters and the regions (in different continents) have local supply chain teams as well. Contracts and orders for goods/services were created both in the regions and the corporate headquarters. The leadership of supply chain saw an opportunity to save dollars in terms of better negotiated contracts and with more rigor on purchases. The strategy is to identify the savings opportunities by region and also in the corporate office, centrally manage the savings and monitor the progress to achieve the promised savings.
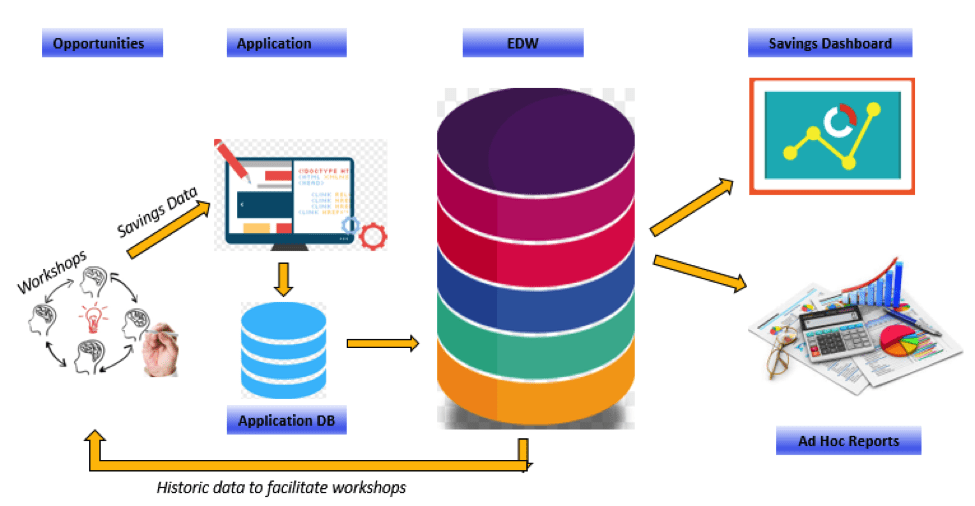
Each region went through workshops to identify potential saving opportunities and they were captured in a simple web-based application. Once the savings opportunities were identified and worked on, progress on them were recorded in the application.
The Data Warehouse aided this process in two ways. First, the Data Warehouse provided the needed historic trend data to conduct the workshops. During the workshops, Business Intelligence reports were run to get the historic spend information along with information about vendors, contracts and purchasing.
Second, the Enterprise Data Warehouse (EDW) enabled reporting and analytics on the savings data. The data about the opportunities and progress to get the target savings were stored in a SQL Server database (back end to the web application). This database became a source for the EDW and data was loaded from this app database into the EDW every night. Savings data from this data source and data from SAP were integrated and a robust data platform was built to perform ad-hoc analysis. A savings dashboard was built using Business Objects Xcelsius to show savings progress along with spend data. This dashboard was to identify opportunities that were not on track and then actioned. The dashboard was also used in the management team meetings to understand and action savings. Here is a high level solution diagram.
The Side Effects
The above mentioned solutions had visible positive impacts among the company’s Business Intelligence (BI) ecosystem and the supply chain business processes itself. Here is how.
The usage of the reporting platform went up gradually after these solutions were rolled out and the spend solution became the top-used BI solution in the company. During meetings and training sessions, these solutions were noticed by the users from the other departments like Finance and Operations and they approached IT to build solutions that are similar to the above described. Thus the self-service BI with drill-down to detail became a standard for BI solution development for the company and increased user adaption by manifold.
The solutions helped expose gaps in the business process and master data. When the solutions were initially rolled out, the business users found issues, like in any other solution. Some of them were actual bugs in the code and some of them were related to gaps in the business process. For example, the spend management team found out that they are missing out on eligible discounts using the spend solution. They made a change to the discount capture process and started netting all the eligible discount dollars. The self-service spend solution also brought to light the missing master data items and also the bugs in master data. The result, a process was put in place so that data gaps will be notified to the Master Data Management team and updated right there with approval.
Conclusion
The above are two examples of many solutions empowered by the Data Warehouse for the supply chain organization. In the same firm, Enterprise Data Warehouse is used in various capacities by operations, finance and human resources. Apart from enabling strategies, the Data Warehouse also enabled the integration of different supply chain sub-functions, which opened up enormous opportunities and efficiencies to supply chain (I will write about this later). To make it all happen, the Data Management team followed rigorous standards and best practices along with training and marketing for the solutions, again, content for many more articles. I would like to conclude with two of my favorite Data Warehousing quotes – ‘EDW is not a project but a journey’ and ‘Do it right the first time’.