Key Takeaways
- Visualization proliferation is a structural outcome of local optimization without architectural governance, not a symptom of underinvestment in data.
- More data does not improve decisions without clear metric ownership, defined purpose, and escalation discipline.
- A three-tier decision architecture aligns metrics to decisions across the enterprise, separating steering, diagnostic, and operational measures.
- AI will amplify existing analytics systems regardless of whether those systems are coherent, making architectural discipline more urgent than ever.
Introduction
In large, multinational enterprises, a common challenge occurs: Senior leaders navigate dozens of contradicting performance visualizations, debating which number is right instead of deciding what to do next. The data exists, the investment in infrastructure is real, and analytical teams are highly capable. And yet, the organization is slower and less confident than it should be. The problem is rarely the data itself. It is the absence of an architecture governing what that data is supposed to decide.
This is fundamentally a design issue, and it appears consistently in large, complex organizations.
Data Architecture Bootcamp
Learn how to design modern data architectures that unify operational, analytical, and AI data – September 2026.

The Structural Cause: Why Dashboards Multiply
Dashboard proliferation in large, globally distributed organizations rarely comes from poor decisions. It typically emerges from hundreds of individually reasonable choices made over time, each solving a local need. A team needs visibility into regional performance and builds a report. A new initiative requires tracking, and someone creates a bespoke visualization. A leadership change prompts a fresh set of metrics. Each decision is defensible in isolation, but none are governed as a whole, and over time the accumulated output of well-intentioned local problem-solving becomes an organically grown infrastructure that was not intentionally designed and is not centrally governed.
This pattern is commonly observed across finance, operations, and commercial organizations, often with different tools but the same underlying outcome. The organizations that invest heavily in data and visualization, that democratize access to analytics and empower citizen development, tend to accumulate complexity faster. According to the 2025 FP&A Trends Survey, drawing on responses from hundreds of finance professionals across industries, only 31% of finance team time is spent on value-added activities such as analysis and strategic insight, while 69% remains consumed by data gathering, reconciliation, and reporting1. Capabilities added without architectural governance become potential future liabilities, and the result is a visualization layer that measures everything but does not create the clarity needed to inform better decisions.
What Dashboard Proliferation Actually Costs
Organizations at enterprise scale routinely spend millions of dollars annually on the applications and visualization infrastructure that supports business performance management. In one enterprise case, annual spend on these tools ran to several million dollars, with a clear mandate to reduce that figure by at least one third through architectural consolidation. That reduction was not achieved by cutting capability, but by eliminating redundancy that had been invisible. Nobody had ever mapped the whole integrated analytics landscape against the decisions it was meant to support – evaluating local needs at the front line of decision-making alongside the regional and global overlays that steer strategy to execution.
| Cost Type | What It Looks Like | Why It Compounds |
| Financial | Redundant licenses and overlapping contracts with visualization vendors; duplicate data product builds | Invisible without an architectural map; grows with each new initiative |
| Organizational | Leaders reconciling contradictory numbers instead of deciding; confusion from conflicting signals across a multitude of performance indicators | Erodes trust in data at precisely the moments that require confidence |
| Strategic | Analysis paralysis at high-stakes reviews | Decisions deferred or diluted by unresolved data and insight conflicts |
The organizational cost runs deeper than the financial one. When the same metric means different things in different parts of the business, confidence in data erodes at exactly the moments it is most needed. Leaders entering high-stakes reviews, often at senior executive or board-level discussions, with contradictory numbers do not make faster decisions; they make slower ones, or they defer them altogether. Analysis paralysis sets in not because people lack data but because they have too much of it, with no governance to establish which data is authoritative for which decision.
This is what I refer to as data-driven confusion. It is a state where the volume and fragmentation of information exceed the organization’s ability to act on it. Not because the data is wrong, but because no architecture exists to determine which data is right for a given decision. The organization has invested in data, the investment looks rigorous, and the outputs are detailed and numerous, but somewhere in the accumulation the information stopped serving the decisions and started substituting for them. Comfort is sought in reducing uncertainty through ever more data, uncertainty that is inherent in any business environment. The abundance itself becomes the obstacle.
Your Data Career Accelerator
The training subscription designed for the busy data professional — from foundational courses to advanced certification.
A Three-Tier Architecture for Decision Clarity
In practice, the issue is not access to data or the quality of visualization. Most organizations already have both. What is missing is a governing architecture that connects metrics to decisions. What is missing in most organizations is not analytical capability but decision architecture: the structural layer that connects measurement to accountability and accountability to action.
The framework that has proven most effective in practice organizes performance measures across three tiers, each with a distinct purpose, a defined audience, and a set of governance rules that prevent the tiers from collapsing into each other. While the Balanced Scorecard established that strategy should translate into measurable objectives across multiple perspectives4, it does not address the structural question of which metrics belong at which organizational level or how escalation between levels should be governed. The three-tier model fills that gap.
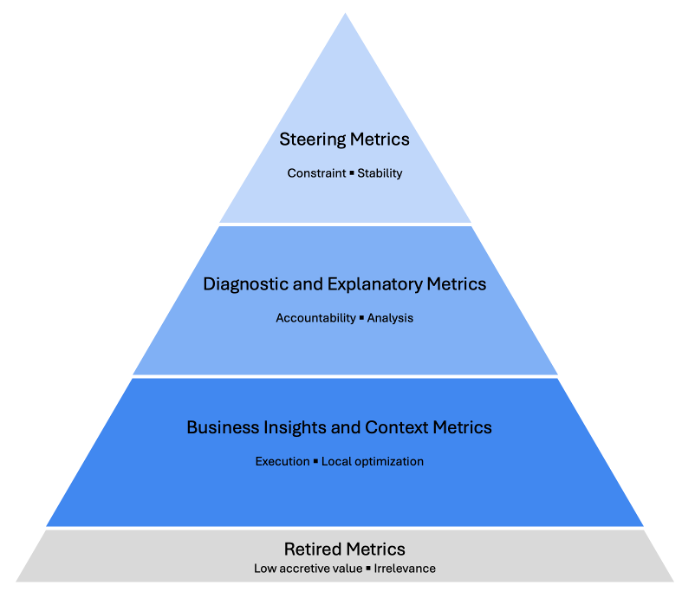
Figure 1: The Three-Tier Decision Architecture Pyramid
Tier 1: Steering Metrics
At the top sits a small, deliberately constrained set of metrics that orient executive judgment on the organization’s most consequential questions. These are not summary statistics or convenience rollups; they are decision triggers, designed to surface the questions that require leadership attention and provide sufficient context to act. At this level, discipline comes from what is deliberately left out: every metric that does not directly inform a decision at this level is a distraction from the ones that do, and organizations that allow their steering tier to expand typically find that executive reviews become longer without becoming more useful.
Tier 2: Diagnostic Metrics
The middle tier explains why performance is moving. When a steering metric signals a problem, the diagnostic layer provides the analytical path to its source, breaking steering indicators into their component drivers and enabling causal analysis at the business unit and functional level. These measures are for the analytical teams whose job is to translate performance signals into actionable explanations and for the business owners who need to understand what is driving the numbers before they can change them. The diagnostic layer connects the strategic signal to the operational reality. Its quality depends heavily on definitional harmonization: a business unit in one geography and a business unit in another must define the same terms in the same way if cross-business comparison and trade-offs are to mean anything.
Tier 3: Operational Detail
The base tier contains the granular operational data that belongs close to the work. This information is essential for execution and local optimization, and it is not appropriate for boardroom agendas. One of the common pitfalls in enterprise performance management is operational detail migrating upward through the organization, consuming executive attention that should be directed at strategic questions. Modern analytics platforms have made this migration technically frictionless, which makes the governance discipline that prevents it more important, not less.
Below the third tier sits an important, often more challenging category that takes genuine organizational conviction to act on: metrics that were historically relevant but no longer materially add insight to improve business results. These have low accretive value and should be proactively retired to reduce low-value work and keep the organization focused on what matters most.
The Governance Layer
The architecture holds only if every metric at every tier carries a clear owner, a defined purpose, and a documented escalation path. Without ownership, definitions drift; without defined purpose, metrics proliferate. And without escalation discipline, the tiers collapse into each other, and the organization returns to where it started, typically with more technology and greater complexity than before.
In practice, one of the more difficult shifts for data-mature organizations is recognizing that fewer, well-governed metrics often create more value than a large set of loosely governed ones.
What this requires in practice is a different starting point: defining the decisions first, then mapping metrics to them, then assigning ownership and escalation paths with discipline. In several transformations I’ve been involved in, the starting point was the opposite, starting from available data and working upward toward meaning, and that is precisely how proliferation begins.
| Tier | Label | Primary Audience | Purpose | Ownership | Why It Fails Without Governance |
| 1 | Steering | Executive leadership | Orient judgment, trigger decisions | Senior leadership | Metrics multiply, reviews grow longer, strategic signal is lost |
| 2 | Diagnostic | Business leadership and supporting analytical teams | Explain performance movement | Finance / analytics function | Definitions diverge across geographies, cross-business comparison breaks down |
| 3 | Operational | Operational leadership | Support execution | Business unit owners | Detail migrates upward, senior leader attention is consumed by operational complexity |
What This Looks Like in Practice
At a global enterprise that had accumulated approximately 3,000 performance visualizations across functions and geographies, sitting on top of 250 separate tools and systems, each solving a local problem and none governed as a whole, I led a fundamental redesign of the performance management infrastructure. The intervention was not to add more technology but to design from first principles what a performance system needs to produce decisions, then build with the discipline to hold that design as the solution scaled.
The outcome was a consolidation from 3,000 visualizations to 150 structured solutions, achieved not by cutting information but by mapping every visualization against the tier it belonged to, the decision it was meant to support, and the owner accountable for it. Annual application and visualization spend was put on a path to reduction of more than one third, not by eliminating capability but by eliminating the redundancy that the deliberate architecture made visible for the first time. For the 250 legacy systems, a clearly defined phased retirement roadmap was committed. In parallel, a single harmonized integrated analytics system was designed and implemented, with a unified data model processing over four billion records annually across more than 200 unified data elements. The foundation was built to connect forward into the organization’s broader enterprise modernization program, ensuring the architectural discipline established here would not become the next layer of complexity.
The value of a well-designed decision architecture is not measured only in reporting efficiency. It is measured in the quality of decisions the architecture enables and in the organizational capacity freed when teams are no longer primarily engaged in managing the complexity of their own measurement systems.
The AI Reckoning
Everything described above was already consequential before generative AI entered the enterprise analytics environment, and its emergence has further sharpened the urgency.
AI does not fix broken performance architecture. In practice, it tends to amplify it. Organizations across every industry are experimenting with deploying AI-powered analytics, forecasting tools, and performance systems at speed, and for organizations that have solved the architecture problem, the returns on that investment will be significant. For those that have not, the result will be data-driven confusion playing out at a much faster pace, with the authority of artificial intelligence behind every contradictory output and hallucination, and a governance problem that compounds faster than any human review process can catch.
The governance stakes are rising in parallel. As AI systems begin influencing financial decisions, the absence of clear metric ownership creates accountability gaps that extend well beyond performance management. When an AI model optimizes against the wrong metric, or against a metric that means different things in different parts of the organization, the confusion does not stay in a meeting room; it propagates through automated decision support before anyone has identified the source. Gartner has predicted that 80% of data and analytics governance initiatives will fail by 2027 due to a lack of genuine organizational crisis or commitment2, a risk that AI deployment could rapidly convert from theoretical to immediate. Legacy metrics that no longer reflect current business realities compound this further: an AI system trained or optimized on outdated measures will confidently amplify the wrong signals3.
The question every data and governance leader should be asking is not how to use AI in their analytics function. The more fundamental question is whether the analytics system landscape is designed for decisions at all, and whether the metrics in use are the right ones, governed at the right level. Most organizations, if they are honest, have not solved that, and AI does not fix it; it accelerates it.
For data and governance professionals, this is precisely where the work is. The three questions that define decision architecture (what decision does this metric serve, who owns it, and what happens when it moves) are governance questions before they are technology questions. Organizations that answer them clearly, at every tier, will be positioned to use AI as a genuine accelerant. Those that do not will find themselves governing faster versions of the same confusion they already have.
References
- FP&A Trends Group. (2025). FP&A Trends Survey 2025: Ambition to Execution. Reported in Gobin, H. “The FP&A Analytics Playbook: Moving to Intelligent Planning.” FP&A Trends, November 11, 2025.
- Gartner. (2024). Gartner predicts 80% of data and analytics governance initiatives will fail by 2027. Gartner Newsroom, February 28, 2024. https://www.gartner.com/en/newsroom/press-releases/2024-02-28-gartner-predicts-80-percent-of-data-and-analytics-governance-initiatives-will-fail-by-2027-due-to-a-lack-of-a-real-or-manufactured-crisis-
- Nieto-Rodriguez, A. (2026). “Are Legacy Metrics Derailing Your Transformation?” Harvard Business Review, February 4, 2026.
- Kaplan, R.S. and Norton, D.P. (1992). “The Balanced Scorecard: Measures That Drive Performance.” Harvard Business Review, January-February 1992.
Data Governance Bootcamp
Learn strategies for planning, designing, and sustaining successful data governance programs – October 6, 13 & 20, 2026.