Data Science is a combination of scientific disciplines “to build predictive models that explore data content patterns,” according to the Data Management Body of Knowledge (DMBoK).
Data Science, formerly known as applied statistics:
“Integrates methods from mathematical, statistical, computer science, signal processing, probability modelling, pattern recognition machine learning, uncertainty modeling and data visualization towards gaining insights and predictive behaviors on big data sets.”
[dv-promo buttontext=’TAKE OUR DATA MANAGEMENT CERTIFICATION PREP COURSES’ buttonurl=’https://training.dataversity.net/learning-paths/dmbok-and-cdmp-preparation-learning-plan?utm_source=dataversity&utm_medium=inline_ad&utm_campaign=DMBOK_LP_temp2&utm_content=copy3′]
According to the Business Intelligence vs. Data Science Report:
“Data Science allows enterprises the ability to turn their data assets into a narrative…Data Science allows that narrative to be expanded across timelines, in different data spaces that trace from the past into the future, with much more involved questions and answers about an enterprise, different potential outcomes, and repercussions based on recommendations. Data Science employs a range of mathematical, business, and scientific techniques to solve complex problems about an organization’s data assets.”
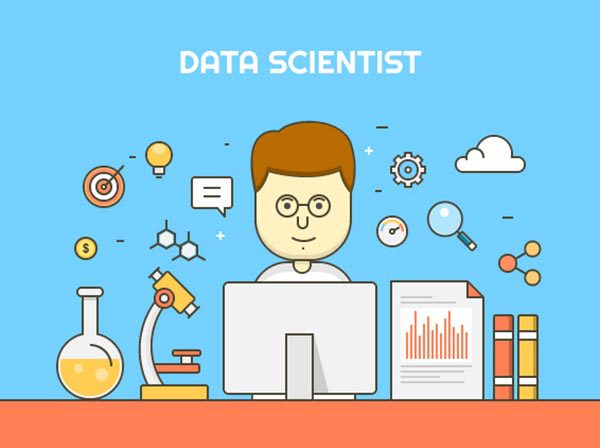
Other Definitions of Data Science and Data Scientists Include:
- A discipline “extracting insight from information assets for ‘big data’ initiatives and requiring a broad combination of skills.” (Gartner IT Glossary)
- “The autonomous or semi-autonomous examination of data or content using sophisticated techniques and tools, typically beyond those of traditional business intelligence (BI) to discover deeper insights, make predictions or generate recommendations.” (Kelle O’Neal)
- “An enabler of data products … including most business functions required to design build, and deploy data products.” (Steve Miller).
- “Analytical and managerial talent to make the most of big data.” (University of Berkeley)
- “How technology has evolved past simple spreadsheet functions or word processing … harvesting insights and analytics from … data collected.” (Scott Matteson)
- “Data driven decision making.” (Forbes)
Businesses Use Data Science to:
- Use Google’s Analytics for marketing.
- Drive business innovation.
- Make product recommendations, increasing revenue.
- Find answers and insights for questions that are not known at the start of analysis.
- Improve operations.
- Create new business opportunities.
- Work with machine learning and artificial intelligence technologies.
Image used under license from Shutterstock.com