In this article, we will focus on the identification and exploration of data patterns and the data trends that data reveals. The business can use this information for forecasting and planning, and to test theories and strategies. Let’s look at the various methods of trend and pattern analysis in more detail so we can better understand the various techniques.
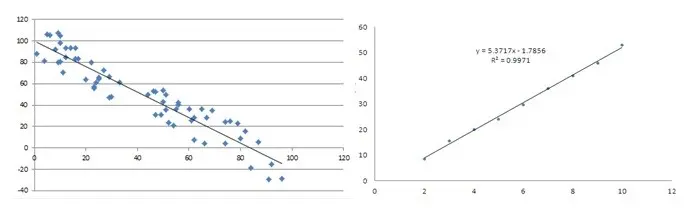
Linear Data Trends
A linear pattern is a continuous decrease or increase in numbers over time. On a graph, this data appears as a straight line angled diagonally up or down (the angle may be steep or shallow). So the trend can either be upward or downward.
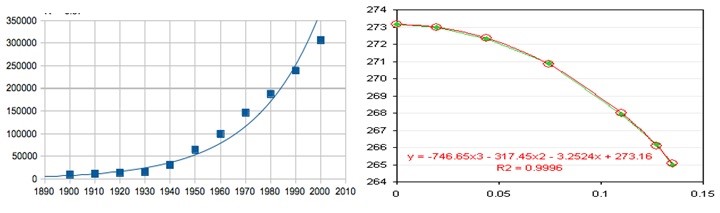
Exponential Data Trends
This technique produces non-linear curved lines where the data rises or falls, not at a steady rate, but at a higher rate. Instead of a straight line pointing diagonally up, the graph will show a curved line where the last point in later years is higher than the first year if the trend is upward.
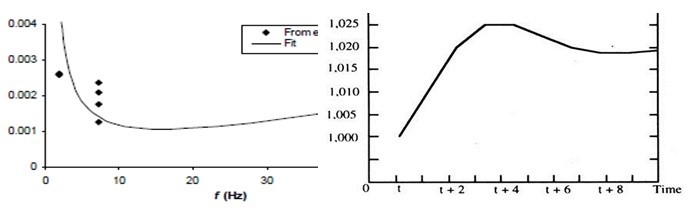
Damped Data Trends
In this analysis, the line is a curved line to show data values rising or falling initially, and then showing a point where the trend (increase or decrease) stops rising or falling.
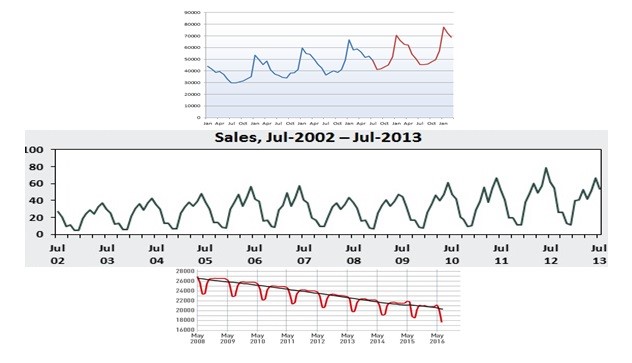
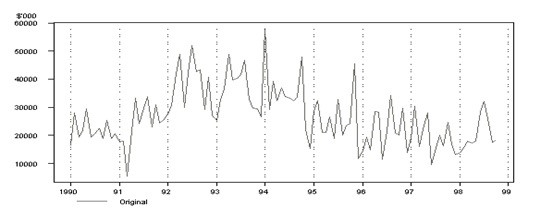
Seasonality
One can identify a seasonality pattern when fluctuations repeat over fixed periods of time and are therefore predictable and where those patterns do not extend beyond a one-year period. Seasonality may be caused by factors like weather, vacation, and holidays. It usually consists of periodic, repetitive, and generally regular and predictable patterns. Seasonality can repeat on a weekly, monthly, or quarterly basis.
Irregular/Random Patterns
This type of analysis reveals fluctuations in a time series. These fluctuations are short and erratic, and follow no regularity in the occurrence pattern. In prediction, the objective is to “model” all the components to some trend patterns to the point that the only component that remains unexplained is the random component.
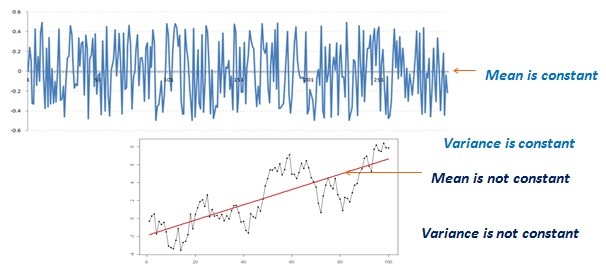
Stationary/Stationarity
A stationary time series is one with statistical properties such as mean, where variances are all constant over time. A stationary series varies around a constant mean level, neither decreasing nor increasing systematically over time, with constant variance.
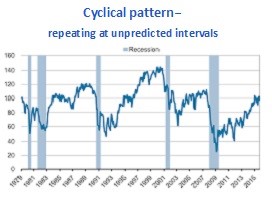
Cyclical Patterns
Cyclical patterns occur when fluctuations do not repeat over fixed periods of time and are therefore unpredictable and extend beyond a year.
Review of Data Trends and Patterns
In this article, we have reviewed and explained the types of trend and pattern analysis. Every dataset is unique, and the identification of trends and patterns in the underlying data is important. If a business wishes to produce clear, accurate results, it must choose the algorithm and technique that is the most appropriate for a particular type of data and analysis. For example, the decision to use the ARIMA or Holt-Winter time series forecasting method for a particular dataset will depend on the trends and patterns within that dataset.
A basic understanding of the types and uses of trend and pattern analysis is crucial if an enterprise wishes to take full advantage of these analytical techniques and produce reports and findings that will help the business to achieve its goals and to compete in its market of choice.