Click to learn more about author Thomas Frisendal.
Did you ever dream about becoming a famous detective? A new (teenage, possibly) Sherlock Holmes? Well, in the area of Data Modeling you now have good chances of showing off how good you are at detecting. What? Well, detecting the data models from evidence, of course.
This can be achieved in a number of ways, and as you would expect, AI is on the billboard.
Machine Learning Data Models
I recently attended a Master Data Management conference in Europe, where I heard a good user story about detecting data models in the Product Information Management space. It is part of the MDM space, and the challenge is that you really have to deal with a complex data model that keeps changing and evolving.
The retailers typically have 6-digit numbers of distinct item types in their shops, and in the food and pharmaceutical retailing businesses there are plenty of characteristics describing the products in much detail. We are talking up to 3-digit numbers of properties, some of them common and other very sparsely used across the board. Add to that that properties vary by market, geography and legislative authorities across the world.
Let me show you some samples – using data from the online shop of Walmart. The “coffee” category can be browsed here. There are about 1000 types of coffee products online at Walmart. Here are a few of them:

As you can see, there are some very different products from ground coffee over ready-to-drink to even coffee filters.
Keeping up with this is handled by PIM tool vendors (MDM vendors) by offering “Flexible Data Models” (see for example Pimcore here). The user story that I heard recently, was based on another PIM product, but the picture is the same. Being able to define specific “characteristics” on the fly (the flexible data model) is fine. The challenge is how to detect new “characteristics”, such as for example this one:

Taken from the Swedish GS1 standard for product information
This retailer attacked the problem with all the incoming new and changed “characteristics” by way of machine learning. Natural Language Processing combined with AI suggests new “characteristics”. The system (based on an open source library) was trained on about 7 % of the products, and it performed quite well on recognizing the new stuff within the ingested PIM data. So this process is repeated every day. With some human handholding and corrections, obviously.
Approaches like this are all about some sort of pattern recognition and other categorization algorithms under the machine learning umbrella. Are there other kinds of algorithms, which may be used by the data model detective?
Graph Detected Data Models
Graph analysis and graph algorithms are known for being able to find structures and patterns.
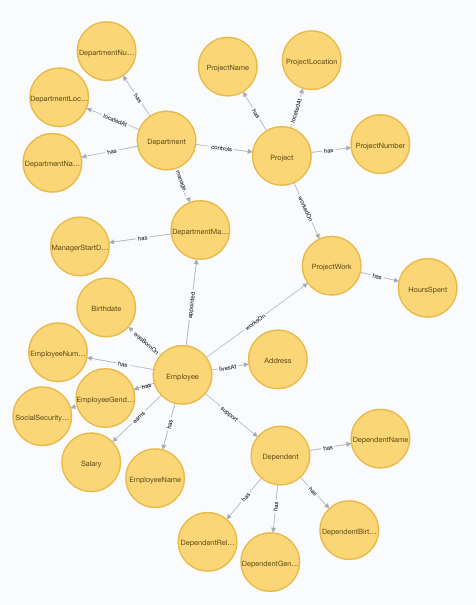
So, I set up a Graph Database (in Neo4j) and imported a graph representing a little data model. This one, as a matter of fact, which comes from Peter Chen’s writings in the 70es:

The data is at the level of “concepts” having “relationships”, which is a simple concept model. The csv-file from above could well have been generated by some text analytics package. In this case, however, the robot was yours truly.
Looking at my sample as a graph gives you this picture:
One very well known graph analysis algorithm is “Page Rank” (known from Google). It is used to relate pages on the internet, so why not use it to look for a data model embedded in a graph?
I tried it (as a standard algorithm in the Neo4j graph platform) on the above, and it did give some indications, but not convincingly. I figure the problem is that my sample is clean, and that page rank is designed for more complex and disorganized contexts.
However, there are some more classic “centrality” algorithms, which are readily available. They are part of the mathematical graph theory toolbox, as defined in Wikipedia here:
“In graph theory and network analysis, indicators of centrality identify the most important vertices within a graph. Applications include identifying the most influential person(s) in a social network, key infrastructure nodes in the Internet or urban networks, and super-spreaders of disease.”
One variety of centrality is “betweenness”, again a definition from Wikipedia:
“In graph theory, betweenness centrality is a measure of centrality in a graph based on shortest paths. For every pair of vertices in a connected graph, there exists at least one shortest path between the vertices such that either the number of edges that the path passes through or the sum of the weights of the edges is minimized. The betweenness centrality for each vertex is the number of these shortest paths that pass through the vertex.”
Betweenness on my little sample gives you this:
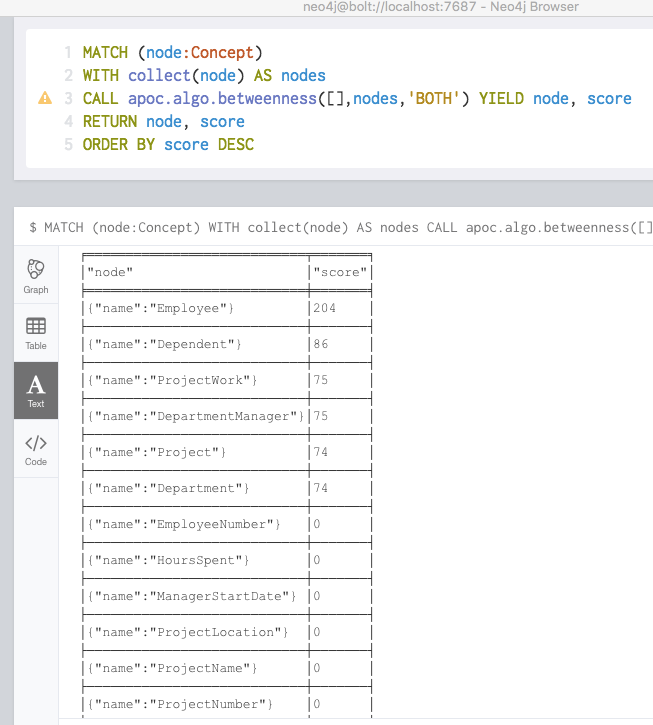
So, a simple inspection be way of a graph algorithm gives you the “entity types”.
Another type of “centrality” is closeness, here is the description from Wikipedia:
“In a connected graph, closeness centrality of a node is a measure of centrality in a network, calculated as the sum of the length of the shortest paths between the node and all other nodes in the graph. Thus the more central a node is, the closer it is to all other nodes.”
Closeness centrality in this case gives you this:
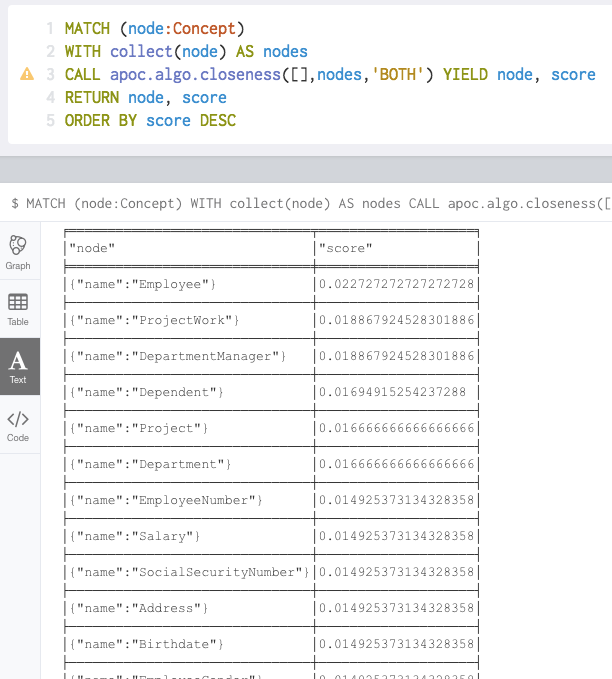
We see the “entity types” and the properties have rather similar scores for the properties belonging to the same “entity type”.
A more pragmatic analysis might be to simply look for all concepts, who have outgoing relationships:
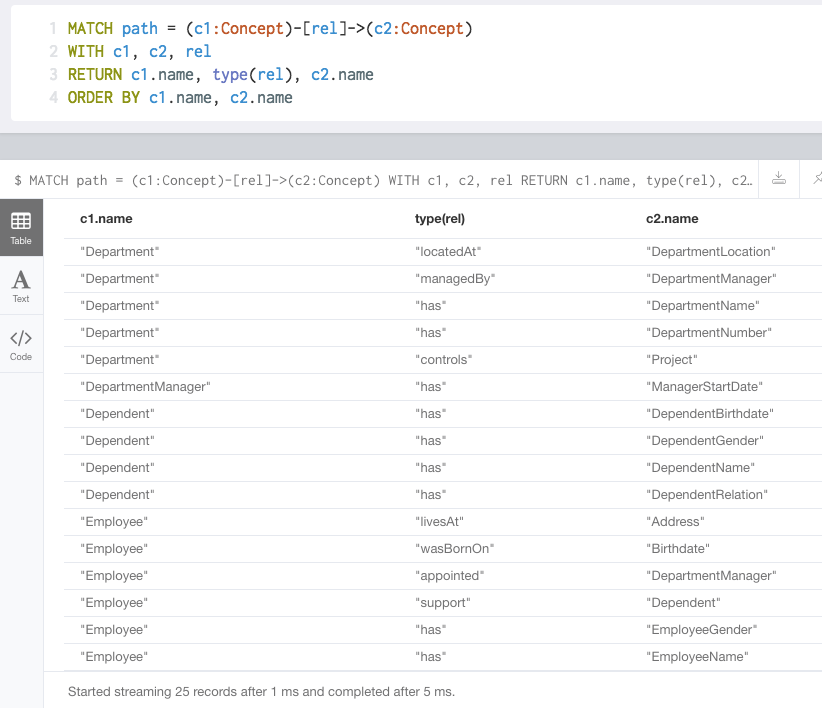
Et voila! The concept model re-emerges (incl. the relationship names)!
Using an approach much like the “adjacency” matrix (Cartesian product of all nodes with distances in each cell of the matrix) of graph theory could also be useful.
In reality, data might be more “muddy” than my clean example, so you would have to use a combination of graph algorithms and queries to detect the real model.
Graphs and visualization are two sides of the same coin, really. So can visualization by itself help you detect something?
Visually Detected Data Models
That should be easy to prove. Here is a little concept model:

I am sure that you, my dear readers, have sufficient supplies of good old intelligence to be able to detect this simple data model embedded in the concept model just above:
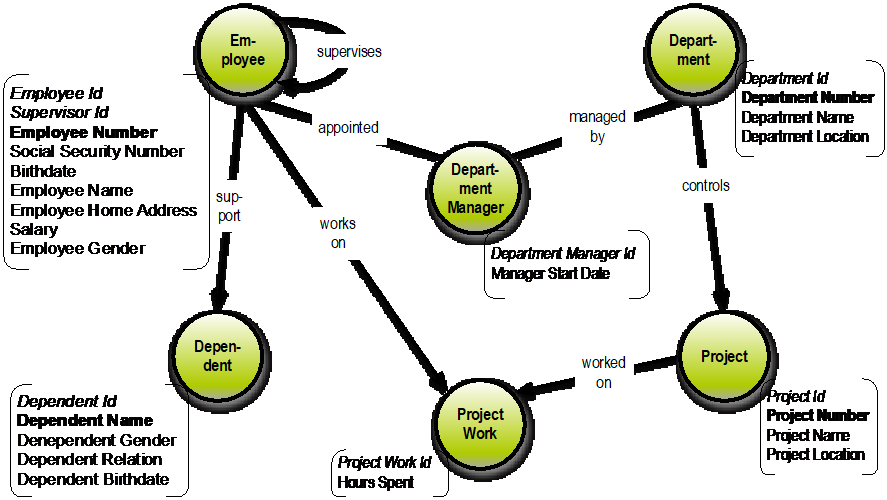
The data model above is of the so-called property graph style. The transformation is easy, with just a few quirks, such as the “supervises” relationship inferred from the “Supervisor ID” property. Visual Data Modeling is really intuitively easy, and our visual intelligence is greater than you think. A good detective tool indeed.
What ever you detect, there will always be human aspects of the process.
Refactoring Data Models
What if you could set up a flexible modeling process that grows with the project and keeps on adding and refactoring to the data model?
In a SQL normalized practice this is a no go. Schema changes every half hour is not what the relational doctor ordered.
But, wait a minute, in NoSQL, and in particular in Graph Database, this is the preferred approach. New type of object? Put it in. New property? Put it in. New relationship? Put it in! No schema is involved, so no schema changes are necessary. Just keep adding evidence of the structure and the meaning – by adding, well, structure and meaning!
To get a reality check, the data base can tell you. What do I have in my graph right now? This is the result of running “CALL APOC.META.GRAPH” on our little concept model database:

The basic “DML” (called Cypher) allows for “mixed mode” scripts, which both create and update (where not exists already), so adding new stuff based on already existing content is rather straightforward. In addition to that there is a collection of refactoring procedures, for operations like renaming, merge nodes, clone nodes, merge relationships and more.
This is one of the strong points for using a graph database for Master Data Management, which is where we started this journey.
What Every Data Model Detective Needs
Tools are plentiful and they are good for you: In particular Machine Learning, Graph Analysis, Graph Database, visualization and intuitive communication.
“Schema last” is the perfect set for the thorough detective. Keep on adding pieces of evidence, refactor, detect and refactor again, as much as necessary, then take it to court!
Intelligence and detecting are related in the real world. All of the tools are just magnifying glasses! What ever you want, what ever you need: It’s your call, you be the detective!