
Today, one of the most popular techniques to achieve high levels of performance and reliability in your software applications is by leveraging the power of microservices architecture. This architectural style breaks down a monolithic application into smaller, more manageable services that can be independently developed, deployed, and scaled. While this approach offers numerous benefits, it also introduces a new set of challenges, particularly when it comes to understanding and troubleshooting the interactions between these services. This is where distributed tracing in microservices comes into play.
Distributed tracing is a technique (terminology used in observability) that allows developers and operations teams to observe and analyze the flow of requests across multiple services and gain insights into the performance of a complex, distributed system. It enables them to pinpoint bottlenecks, identify latency issues, and optimize the overall performance of the application.
In this comprehensive guide, we will explore the importance of distributed tracing in microservices, the key concepts and terminology, how it works, integration with other telemetry signals, and a few meaningful practices for implementation.
Understanding the Importance of Distributed Tracing
Since a picture is worth a thousand words, here is an old image of how the microservices’ environment in Netflix used to look in 2014. Imagine how much it must have grown by now.
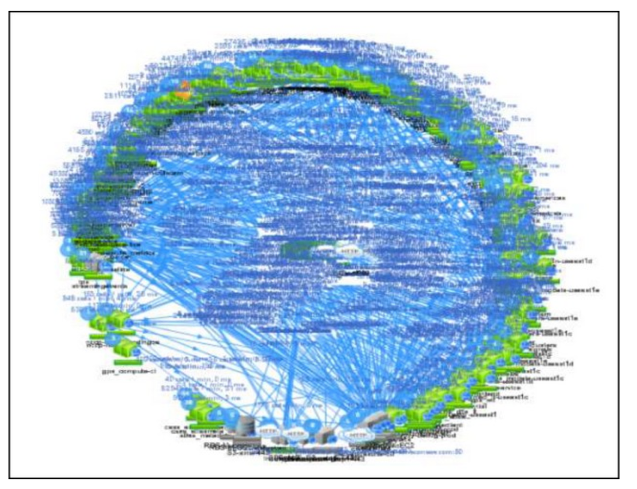
In a microservices architecture, a single user request might involve multiple services communicating with each other to fulfill the request. Each service might be developed using different programming languages, run on different infrastructures, and be managed by different teams. This level of complexity and decentralization can make it extremely challenging to understand the system’s overall behavior and troubleshoot issues that might arise.
Distributed tracing provides a solution to this challenge by giving you the ability to track the flow of a request as it traverses through the various services in your system. This enables you to:
- Identify performance bottlenecks: By analyzing the traces, you can pinpoint the services that are taking longer than expected to process requests, thereby causing delays in the overall response time of the application.
- Improve end-to-end visibility: Distributed tracing gives you a holistic view of the entire system, making comprehending the relationships and dependencies between services easier.
- Detect and diagnose issues faster: With distributed tracing, you can quickly identify the root cause of an issue by analyzing the traces and identifying the exact service where the problem occurred, significantly reducing the mean time to resolution (MTTR).
- Optimize resource allocation: By gaining insights into the performance of individual services, you can make informed decisions about where to allocate resources to enhance your application’s overall performance and efficiency.
Key Concepts and Terminologies in Distributed Tracing
Before diving into the details of distributed tracing in microservices, it’s crucial to understand some key concepts and terminology. Here, we will understand these concepts through OpenTelemetry, an open-source observability framework for instrumenting, processing, and exporting telemetry data from systems.
- Trace: A trace is a collection of spans that represent the end-to-end execution of a request or transaction in a distributed system. It provides a complete picture of the request’s journey across multiple services.
- Span: A span represents a single unit of work performed by a service in the context of a trace. It typically includes metadata such as the start time, end time, duration, service name, and the operation being performed.
- Parent and child spans: Spans can be related to each other through parent-child relationships, which indicate a causal dependency between the operations represented by the spans. For example, a parent span might represent a service calling another service, and the child span would represent the called service’s operation.
- Trace ID: A unique identifier assigned to each trace, which is propagated across all services involved in the request to link the spans together.
- Span ID: A unique identifier assigned to each span within a trace.
- Baggage: Additional contextual information that can be attached to a trace and propagated across services, allowing for better correlation and analysis of the trace data.
How Distributed Tracing Works in Microservices
The process of distributed tracing in microservices involves the following steps:
- Instrumentation: The first step is to instrument your services to generate traces and spans. This can be done using open-source libraries, commercial tools, or custom code. Instrumentation typically involves adding code to your services to create spans, capture metadata, propagate trace and span IDs, and report the data to a tracing backend.
- Propagation: As requests flow through your system, trace and span IDs are propagated across service boundaries, usually through HTTP headers or other messaging protocols. This ensures that all spans generated by the various services can be linked together to form a complete trace.
- Collection: The generated trace data is collected and sent to a tracing backend, which can be an open-source system like Zipkin or Jaeger, a commercial solution, or a custom-built tracing infrastructure.
- Processing and storage: The tracing backend processes and stores the trace data, often enriching it with additional information, such as service topology, performance metrics, and application logs.
- Visualization and analysis: The trace data is visualized and analyzed, usually through a web-based user interface like Grafana, allowing you to explore the traces, identify performance issues, and gain insights into the behavior of your distributed system.
Integrating Distributed Tracing with Other Telemetry Signals
To understand your microservices’ performance, it’s crucial to integrate distributed tracing with other monitoring and observability telemetry signals.
- Metrics: Combine trace data with metrics, such as request rates, error rates, and latency, to get a comprehensive view of your services’ performance and identify trends and anomalies.
- Logs: Correlate trace data with application logs to gain deeper insights into the root causes of issues and understand the context of specific operations within a trace.
- Alerting: Use trace data to inform alerting and notification systems, allowing you to detect and respond to performance issues and incidents proactively.
- Service topology: Visualize the dependencies between your services using trace data, providing a clear understanding of how your system is structured and how requests flow through it.
Meaningful Practices for Implementing Distributed Tracing
To successfully implement distributed tracing in your microservices, consider the following simple yet meaningful practices:
- Start with a consistent naming convention: Use a consistent naming convention for services, operations, and tags to make it easier to search, filter, and analyze your trace data.
- Leverage context propagation: Ensure that trace and span IDs, as well as any baggage, are properly propagated across service boundaries to maintain the continuity of traces.
- Instrument critical paths: Focus on instrumenting the most critical paths in your system, which are likely to have the most significant impact on performance and reliability. You can then incrementally add more instrumentation as needed.
- Capture meaningful metadata: Include relevant metadata in your spans, such as operation names, service names, and tags that describe the context of the operation. This will help you better understand your traces and diagnose issues more effectively.
- Integrate with monitoring and observability signals: To gain a holistic view of your system’s performance, integrate your distributed tracing solution with monitoring and observability telemetry signals, such as metrics and logs for correlation.
Conclusion
Distributed tracing is a critical component of any microservices-based architecture, providing the visibility and insights needed to optimize performance, troubleshoot issues, and ensure the overall reliability of your application. As the adoption of microservices continues to grow, we can expect to see further advancements in distributed tracing technology, including new tools, integrations, and innovations to help organizations gain even greater insights into their complex, distributed systems.
Remember, the goal is not just to collect data but to use that data to drive performance improvements. And with the right approach, you can turn the observability of distributed systems from a challenge into a strategic advantage.