
Click to learn more about author Aditi Sinha.
“Location” is critical for app-based delivery, logistics, and mobility companies.
Who is this for?
An app-based delivery company delivers whatever users order through their app right at the user’s location, anytime. On-demand companies, such as food delivery companies, supply chain companies like e-commerce businesses, hyperlocal delivery companies, and mobility companies, all come under this category.
So, what is common to all these businesses with on-ground operations? The answer is — location. Every event happens somewhere, and, as a result, knowing that location becomes important in driving the business forward. Hence, location becomes very important as a parameter to include in strategies and decisions.
But, how can user acquisition, conversion, and retention be increased using location analytics? Believe it or not, geographic patterns about these metrics can tell us a lot about our business and users. For example:
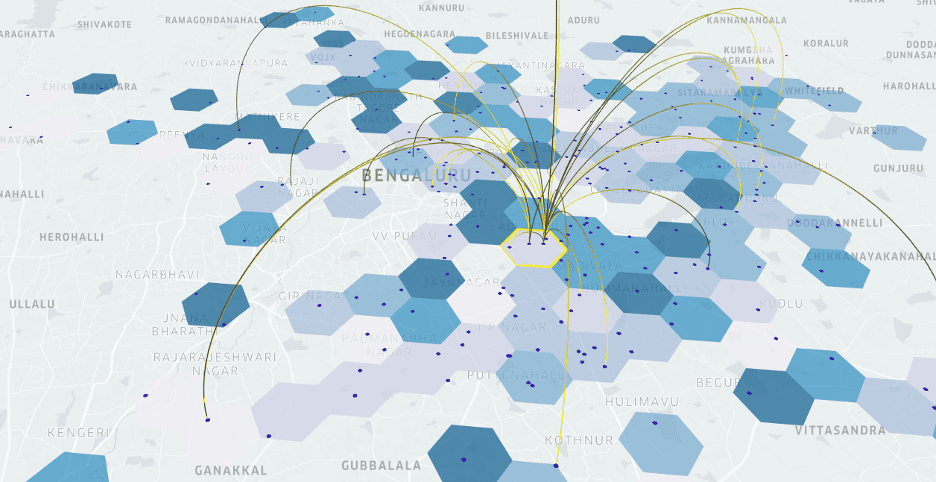
A lot of people open your app. But not everyone ends up placing an order. A number of them churn out. What does this mean? It means that they don’t convert to customers. It is crucial to know where this churn density is worryingly high.
In this piece, we will explore how you can improve your user acquisition, conversion, and retention using location analytics.
Maximizing User Acquisition
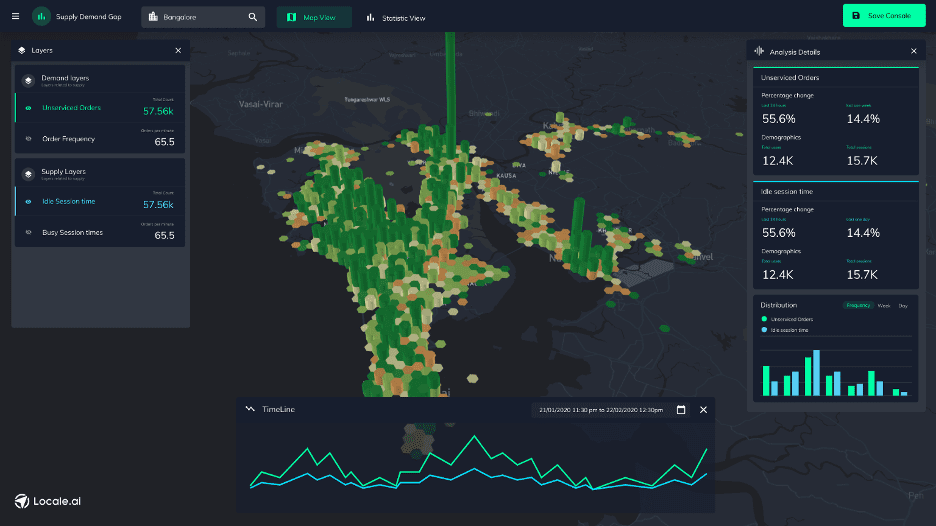
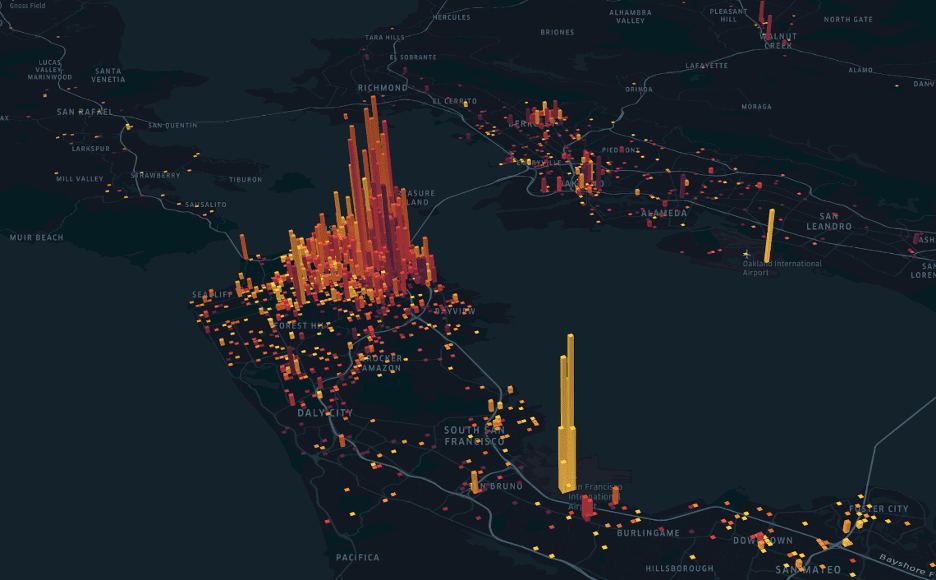
Acquiring users in locations where there is already demand will help to reduce your CAC (customer acquisition cost). This is why the metric of latent demand becomes very important in terms of app installs, searches, and orders placed — in order to realize where you want to expand next.
What do we mean by expansion? You can use this insight to decide where to open up a new vehicle station, where you need to establish partnerships with stores, restaurants, or charging stations, and/or which location to become serviceable in.
When it comes to mobility companies, the burning questions that are foremost in the minds of CXOs will be: How do my most important users behave? Where do they move to? Do they show any specific patterns, etc.?
Increasing User Conversion
Churn is at the core of conversion, and that philosophy guides the entire decision-making process at a business. Today, when people do churn analysis, they only look at the persona and that step of the funnel. Every user that didn’t convert is revenue lost right in front of their eyes.
However, analyzing where the churn is happening is critical because that helps to identify where you need to improve operations, adjust provision supply, or do offline marketing.
Between when a user opens the app to when they finally make a payment for their order, there are a large number of steps that occur in between within the app.
To book a ride:
Enter destination → Searching the nearest bike → Selecting the bike → Starting the trip.
To order food:
Select cuisine → Select restaurant → Select the dish → Checkout → Make payment.
For example, a grocery company that we are working with realized that people were churning out from the ordering process once they saw the SLAs and realized they could get better SLAs somewhere else! When we plotted the churn data, we noticed some high-density clusters in some specific cities, and the team started focusing on provisioning more delivery partners in those areas.
Increasing User Retention
After converting a single user, how do you ensure repeatability and retention? After all, we all know that retention is one of the most important metrics for a company as it ensures consistent revenue. But with more and more competition and increased choices available to users, one can switch apps at the tap of a button — something that makes retention tougher.
Location can help in retaining users as well as pushing very targeted promotions based on the user’s location and behavior.
For example, if you are a micro-mobility company who has just discovered that college students traveling from the campus are your power users, you might consider subsidizing those routes to incentivize them!
This is a form of out-of-home (OOH) advertising. It is a popular marketing strategy to nurture and retain your users, and the success of this strategy depends on the right messaging and the location.
How Can You Use This Location Data?

Web marketers use Google Analytics to understand the health of their web page and to leverage user behavior to make strategic decisions. Similarly, a lot of companies are on the lookout for any SaaS tool that can help businesses with on-ground operations to leverage location data and make decisions on a hyperlocal scale.
Companies sometimes try to build these tools internally, but the dashboards are often not customizable, and this requires a lot of effort and time from the engineering teams. A tool that could help business teams make quick, strategic decisions without having to wait for answers to their queries from the Data Science teams could help businesses grow.
How can you improve in the discussed areas using location analytics?
1. Acquisition
Demand mapping lets you analyze the search results, user behavior patterns, and their geographic spread by running your collected location data through analyses. Growth heads can use these insights to identify which areas have gone untapped for the business in different categories.
2. Conversion
Churn analysis helps you track how, why, and where users who open the app end up not converting into paying customers. Whether you need to open a vehicle station hub to provide more stations or call the manager of the restaurant with the highest prep time or do some offline events — the decision is yours.
3. Retention
What if you knew exactly when and where to shoot offline advertisements to increase user retention, all derived from your location data? Workflow modules help companies to send very targeted geo-promotions to their users or get alerts in case their KPIs observe anomalies.