In the buzzing world of data architectures, one term seems to unite some previously contending buzzy paradigms. That term is “knowledge graphs.”
In this post, we will dive into the scope of knowledge graphs, which is maturing as we speak.
First, let us look back. “Knowledge graph” is not a new term; see for yourself in this clipping from Wikipedia (accessed April 26, 2023):
The term was coined as early as 1972 by the Austrian linguist Edgar W. Schneider, in a discussion of how to build modular instructional systems for courses. In the late 1980s, University of Groningen and University of Twente jointly began a project called Knowledge Graphs, focusing on the design of semantic networks with edges restricted to a limited set of relations, to facilitate algebras on the graph. In subsequent decades, the distinction between semantic networks and knowledge graphs was blurred.

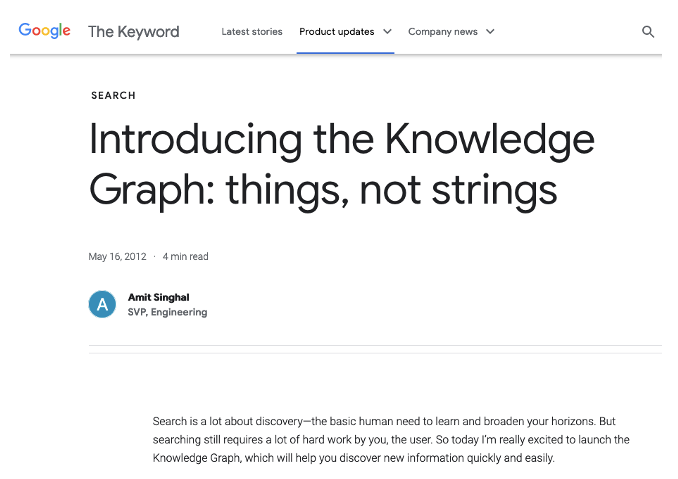
So, it is a European idea. But it took many years for it to get a real breakthrough. And that happened in the U.S.: In 2012, Google posted this on its blog:
Google’s knowledge graph was, initially, partially built on top of DBPedia and Freebase and was amended by impressive amounts of information from many other sources. Most tech companies joined the movement, including Facebook, LinkedIn, Airbnb, Microsoft, Amazon, Uber, and eBay, to mention a few.
Google’s adoption of the knowledge graph paradigm really changed the public interest. Here is an “Interest over time” curve from Google Trends (drawn in early April 2023):
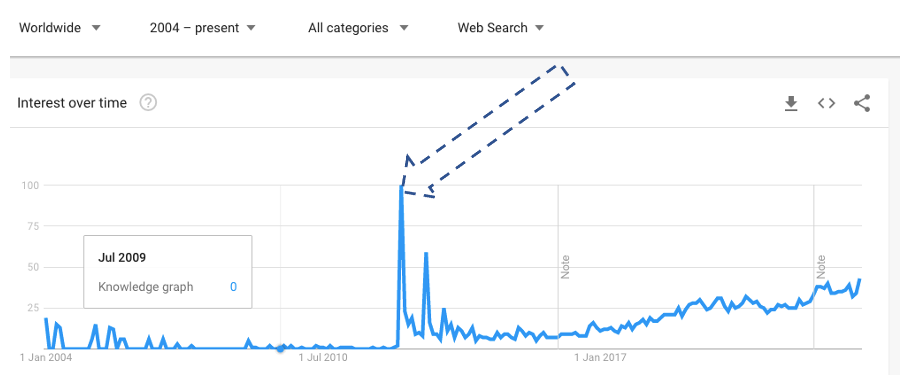
And the interest is steadily growing in our time.
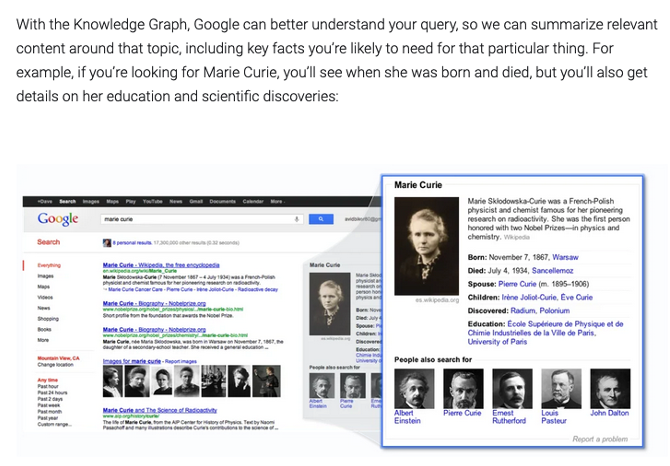
Here is Google’s introductory explanation in the 2012 blog post:
Knowledge management technologies came out of the semantic web community based on concepts such as RDF (Resource Definition Framework, a stack for defining semantic databases, taxonomies, and ontologies), open world assumptions, linked open data (on the web), and semantics with inferencing. That movement started in 1999, but the semantic industry struggled to get market attention. Many of the supporters said that “we need a killer application!” Well, knowledge graphs are just that. Congratulations!
Knowledge Graphs in the Contemporary Buzzword Soup
As it happened, 2012 was also in the period when the Apache Foundation (with the Tinkerpop specification) as well as Neo4j (out of Sweden) got sizable market attention on their so-called “property graph” approaches to graph modeling.
Google started to collect data on “Interest over time” for very many search terms in 2004. I have collected a little collection of buzzwords related to, or in contradiction of, knowledge graphs. Reduced to yearly numbers (Google Trends uses months), I am proud to present a “Buzzword Pixie from the Data Jungle”:
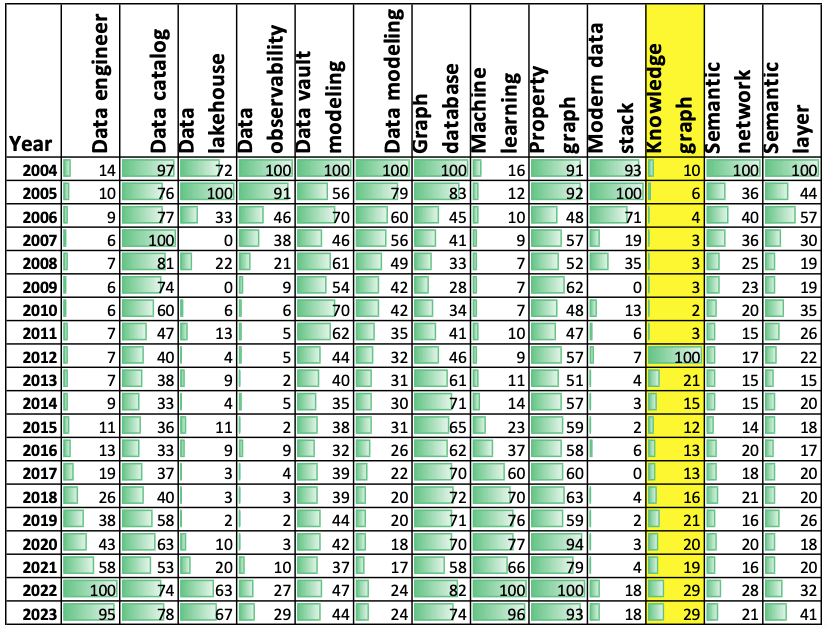
Looking for trending buzzwords, I notice: data engineer, data catalog, data lakehouse, data modeling (admittedly modest numbers), data observability, data vault, graph database, machine learning, property graph, knowledge graph, semantic networks, and semantic layer. So, the combined list of goodies found in those paradigms is what is moving forward. To build a modern knowledge graph, you must look toward those requirements.
Is Knowledge Graph a Technology Battle?
I did not include RDF in my interest-over-time Pixie book above. Here is the reason (again from Google Trends):

Compared with some of the contemporary buzzwords, RDF is not a winner. However, it qualifies to become part of the not-so-charming category of legacy databases. The data world is full of useful taxonomies and ontologies, which many organizations cannot live without. From a data perspective, property graph databases buzz a lot stronger.
Can you build semantic networks in property graphs? Yes, you can! Look up, for example, Neo4j’s Neosemantics, and you will see that interoperability is indeed very real:
neosemantics (n10s) is a plugin that enables the use of RDF and its associated vocabularies like (OWL,RDFS,SKOS and others) in Neo4j. RDF is a W3C standard model for data interchange. You can use n10s to build integrations with RDF-generating / RDF-consuming components. You can also use it to validate your graph against constraints expressed in SHACL or to run basic inferencing.
Add to that leading DBMS providers include both sides of the graph DBMS technologies into their product. Here is a quick survey by the undersigned:
- Microsoft Azure Cosmos DB
- NoSQL, MongoDB, Cassandra, Gremlin, Table, PostgreSQL
- Microsoft Azure SQL / SQL Server, SQL, Property graph
- Amazon Neptune
- openCypher, Gremlin, SPARQL (RDF)
- Oracle
- SQL, SQL PGQ, RDF, XML
- REDIS
- openCypher, key-value
- IBM DB2
- SQL, RDF
- MariaDB
- SQL, OQGraph
- Teradata
- SQL, SQL-GR
- SAP HANA
- SQL, openCypher
- Datastax/Cassandra
- CQL, Gremlin
Property graphs have an easy learning curve, whereas RDF stores have a steep learning curve. In my opinion, 80% of ordinary, daily knowledge graph activities are easily (i.e., quickly) solved in property graph – with good quality. Querying property graphs is also considerably easier and the choice of really nice graph browsers is overwhelming. Finally, property graphs are highly performant in highly connected graphs with many nodes and even more relationships. We need that, as you will see further down in this post.
So: The name of the game is to combine the best of the two worlds.
Fortunately, the integration is easier because of existing paradigm parallelisms, which are already in place.
Uniting by Way of Decomposition
The secret sauce is that both RDF and property graphs are, well, graphs. And graphs have been handled by a small army of mathematicians over a couple of hundred years. There is a solid theoretical background to take advantage of. One of the challenges is “isomorphism” of graphs. Pretty nifty mathematics designed to answer the question of whether two graphs are comparable. One of the easier ways of looking at this is called defining a canonical form of the graphs – sometimes called graph normal form. This starts at the most basic structural building block of graphs:
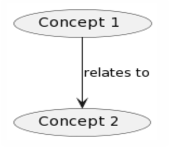
This is found in many contexts: The ISO 24707 Common Logic standard with its conceptual graphs built from concepts and relations, “fact statements” (conceptual modeling and object-role modeling, ORM), triples (RDF, semantics, ontologies, etc.), relationships/edges (various kinds of property graphs), and functional dependencies (between and inside) relations in relational theory.
Here is an example of a canonical graph representation – call it graph normal form, if you like:
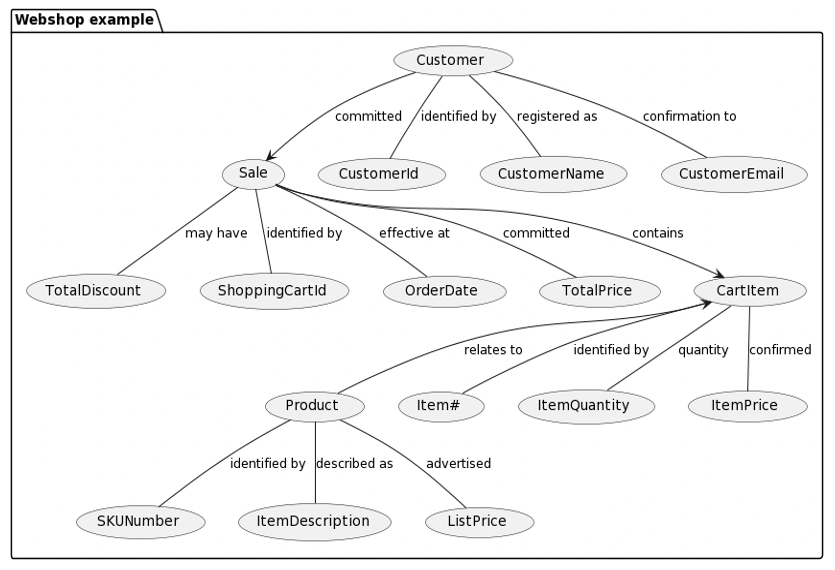
This representation is almost a collection of subject-predicate-object occurrences. In RDF they are called “triples” and they are the basic building blocks of triple stores (RDF databases). There are some extensions on top of this, but they can be handled.
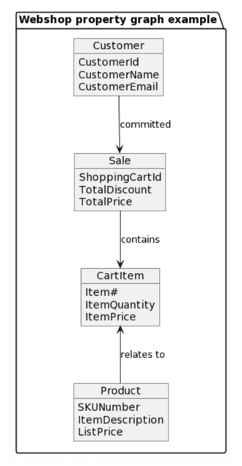
If we want to build a property graph representation of this webshop example, note that property graphs can be seen as materializations (logical or physical) of the decomposed graph normal form representations of some semantic data models. Some properties are aggregated to become attributes of different node/vertex types, and/or also on different edge/relationship types. Properties on relationships are not shown in this sample diagram:
So, if we want to build knowledge graphs that share information from RDF stores (ontologies for example) and property graphs (operational data for example) we need to have the canonical form at hand – making mappings and so forth practicably available.
The canonical form is clearly the top level of metadata, which brings us to the next observation.
The Metadata and the Content Are Related
Graphs (both RDF and most property graphs) are based on the so-called open world assumption, which leads to benefits such as:
- One of the most popular capabilities of leading property graph database products is “schema-less” development. Meaning that no schema is necessary for loading data.
- Inspections, using graph queries, of the data contents lead to – over some iterations, probably, a better understanding of the data model, sort of a prototyping approach to data modeling.
- The structures of the graph data model might be iteratively changed (no schema to change).
- A canonical form of the inner graph structure is easy to derive (inside your head) from the graph elements, including edges/relationships and the structures they represent. The canonical form can remain the same, even after structural changes such as rearranging the allocation of properties to nodes and edges/relationships are performed.
- This is in contrast to the relational/SQL model, where a canonical form is not that easy to visualize just by looking at the structure (not all dependencies need to be explicit). And, if the SQL data model undergoes deeper normalization, denormalization or combinations of both, keeping mentally up with an intuitive understanding of the semantics will grow more and more complex.
- It is all about the distance between the logical data model and a corresponding conceptual data model – which in graph models is easy to grasp, even without visualization. This makes graph data models more robust and flexible.
The Metadata and the Content Evolve – Together!
In my earlier blog post 2023: Mitigating Data Debt by Knowing or by Guessing? I introduced a little concerns dependencies model, which can be summarized like this:
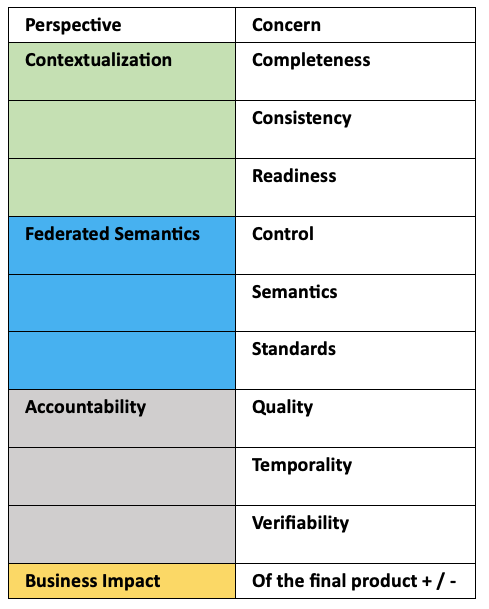
It is rather obvious that the metadata and the content evolve, together! And in our times these changes are blindingly fast. If you must keep up without costly re-reengineering efforts, you must deal with changes in metadata and in business data, as they occur. You are streaming in facts, which are morphing as you look. Obviously, you must deal with:
- Dynamics are value-driven
- Impact analytics after the fact
- Integrations and lineages
- Discovery (the graph way)
- Dependencies not linear
- Outcomes and usages
- The web is a graph
- Your mesh (web) is a graph
- Know your space(s)!
So, changes occur daily, i.e., you must keep track of them in your knowledge graph!
The combination of contextualization, federated semantics, and accountability dictates that you should (and could) build a knowledge graph in 2023.
You can do that by:
- Leveraging APIs to semantic media such as Google, Apple, Microsoft, etc. and/or
- Take advantage of open semantic sources such as
- Wikidata
- Industry standard ontologies
- International and national standard ontologies
- Other more or less open sources such as Opencorporates and more
You can build it in property graph technology, which has an easier learning curve than RDF.
You can use your own knowledge graph as an important part of the data contract with the business (make requirements machine-readable).
You can use your knowledge graph to make completeness tests as well as look for accountability features, missing information, (lack of) temporality information, and so forth.
You can use a graph prototype as a test and verification platform for the businesspeople.
What Does My Knowledge Graph Look Like?
Well, we must build something that:
- Combines data and metadata
- Has a canonical concept model in its core
- Can work with ontologies etc. from the RDF world
- Handles various kinds of graph models
- Handles recordkeeping, including
- timeline-based versioning
- retention and archival
- usage consents
- Handles mappings and observations about data quality, lineage, sources, interfaces, etc.
- And, oops, I almost forgot:
- Has fresh operational and historical data as graphs, maybe also property graph views on top of SQL databases
Here is a work-in-progress architecture of a modern, mature knowledge graph:
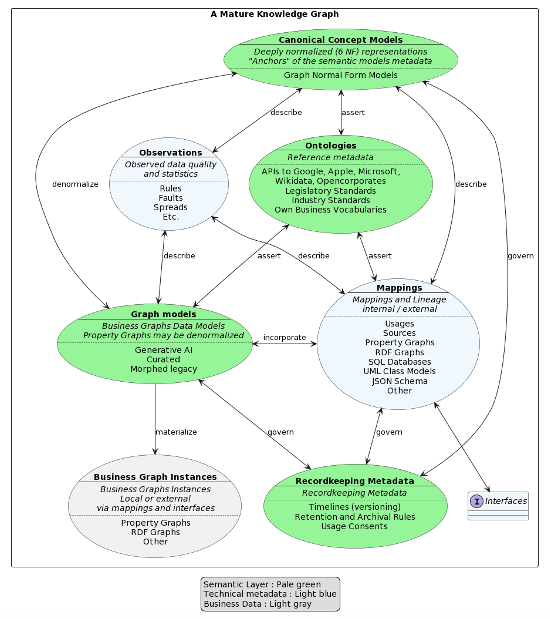
This is a work-in-progress, and I will return to it in later blog posts; for now, just a few comments.
There are three purpose-oriented “subgraphs”:
- The semantic layer – model-oriented metadata, the schema information graph
- Technical metadata describing data characteristics such as mappings, lineage, and physical stores, as well as data quality issues
- Business graph instances – the real, operational data included in the knowledge graph; be it physically or via mappings (such as SQL-PGQ) to external databases.
One thing that is immediately obvious is that the combination of metadata and data creates a complex, highly connected graph. In other words, you need a property graph for dealing with it, and you all the help that you can get for maintaining the semantics and the relationships on the fly. Generative AI (though it must be curated) is certainly on the roadmap for assistance with data modeling, and data models as code are also a necessity.
Also note that “ontologies” is meant in a broad sense; you might want to include information available via APIs from external knowledge graphs or search interfaces maintained by Google, Apple, Microsoft, Wikidata, or even the EU Knowledge Graph – not to mention generative AI services.
Another obvious observation is that the canonical concept models serve as anchorpoints/placeholders for almost all other metadata in knowledge graph. Here is an example outlining how timeline-based versioning could be defined:
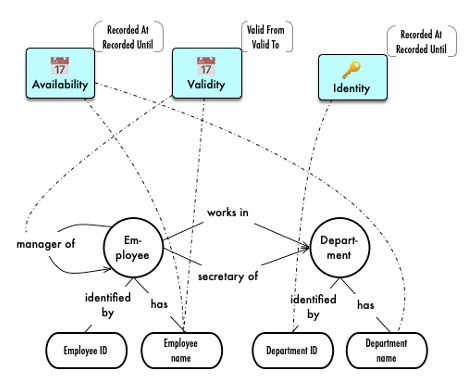
The canonical concept model is in the lower half, whereas the blue labels in the upper half are recordkeeping metadata establishing three named timelines (and their associated graph property concepts):
- Availability (in the business)
- Validity (for the business)
- Identity – uniqueness handling over time
The dotted lines are meta graph relationships linking the recordkeeping metadata with the canonical model.
Similarly, the canonical model is “owner” of the ontology metadata entries as well as of the graph model metadata on the semantic level; and it also “owns” the technical metadata mappings, lineage, and observations. The sum of all those subgraphs is a large, highly connected knowledge graph!
The real game-changer is to look at metadata and data together and handle them together as daily incoming flows of changing metadata and data. Changes do occur frequently, and a robust recordkeeping approach is a necessity.
© Thomas Frisendal, 2023, CC BY-SA 4.0