Click to learn more about author Thomas Frisendal.
Pointers have been in and out of data models. From the advent of the rotating disk drive in the 60s and until around 1990, pointers were all over the place (together with “hierarchies”, which were early versions of aggregates of co-located data). But relational and SQL made them go away, only to reappear around year 2000 as parts of Graph Databases.
Although summer is over, this post is easy going and comes around. Join me on a hopefully fascinating journey of the history of pointers in data models.
Pointing at Things
Pointing is a very basic gesture for humans.

by Hillebrand Steve, U.S. Fish and Wildlife Service [Public domain], via Wikimedia Commons.
Nobody is in doubt about what the intention is, regardless of culture, language and circumstance. Pointers are one of the strongest visualization tools in our possession. That is why I am so much in favor of directed graphs, as in e.g. concept maps and property graphs.
Now I am pointing at pointers – over there, please!
Episode 1: Pointer DMBS’s
One of the very first data stores was from IBM (in 1960). Its predecessor, which ran on magnetic tape, was called BOMP. It stands for Bill of Materials Processor. It was developed specifically for some large manufacturers, who needed to be able to do what later became materials requirements planning.
Once BOMP was adapted for the new, revolutionary disk storage technology, it changed name to DBOMP, this time meaning “Database Organization and Maintenance Processor”! This happened in 1960. It was generalized somewhat and it does qualify as one of the first disk-based data stores.
It was based on the concept of pointers which was the new very exciting possibility of rotating disks. Some added common sense was also added – the developers soon went away from raw disk addresses to schemes with blocks of data and index-numbers for rows on the block. Plus some free space administration. The blocks (and with them the data) could then be moved around on the disk. (In the beginning there was typically only one disk).
Here is a greatly simplified bill of materials structure (tree) of a bicycle:

Now, when you read and manipulate bills of materials, you need to:
- Go from the item master for a product (or intermediate) to the items used in that product, commonly seen as the product structure tree
- Go to the where used item (the owner)
- Go to the next in the structure
- Go to the next in the “where used” set of records
- Sometimes you need to go the prior, also in both of the sets (structure and where used)
- Sometimes you need to position yourself by way of a PART-NUMBER lookup and then continue downwards (structure) or upwards (where used) from there.
For all of that you need a lot of relationships, which at that time translated into pointers.
Here is a simplified view of the basic DBOMP pointer structures:
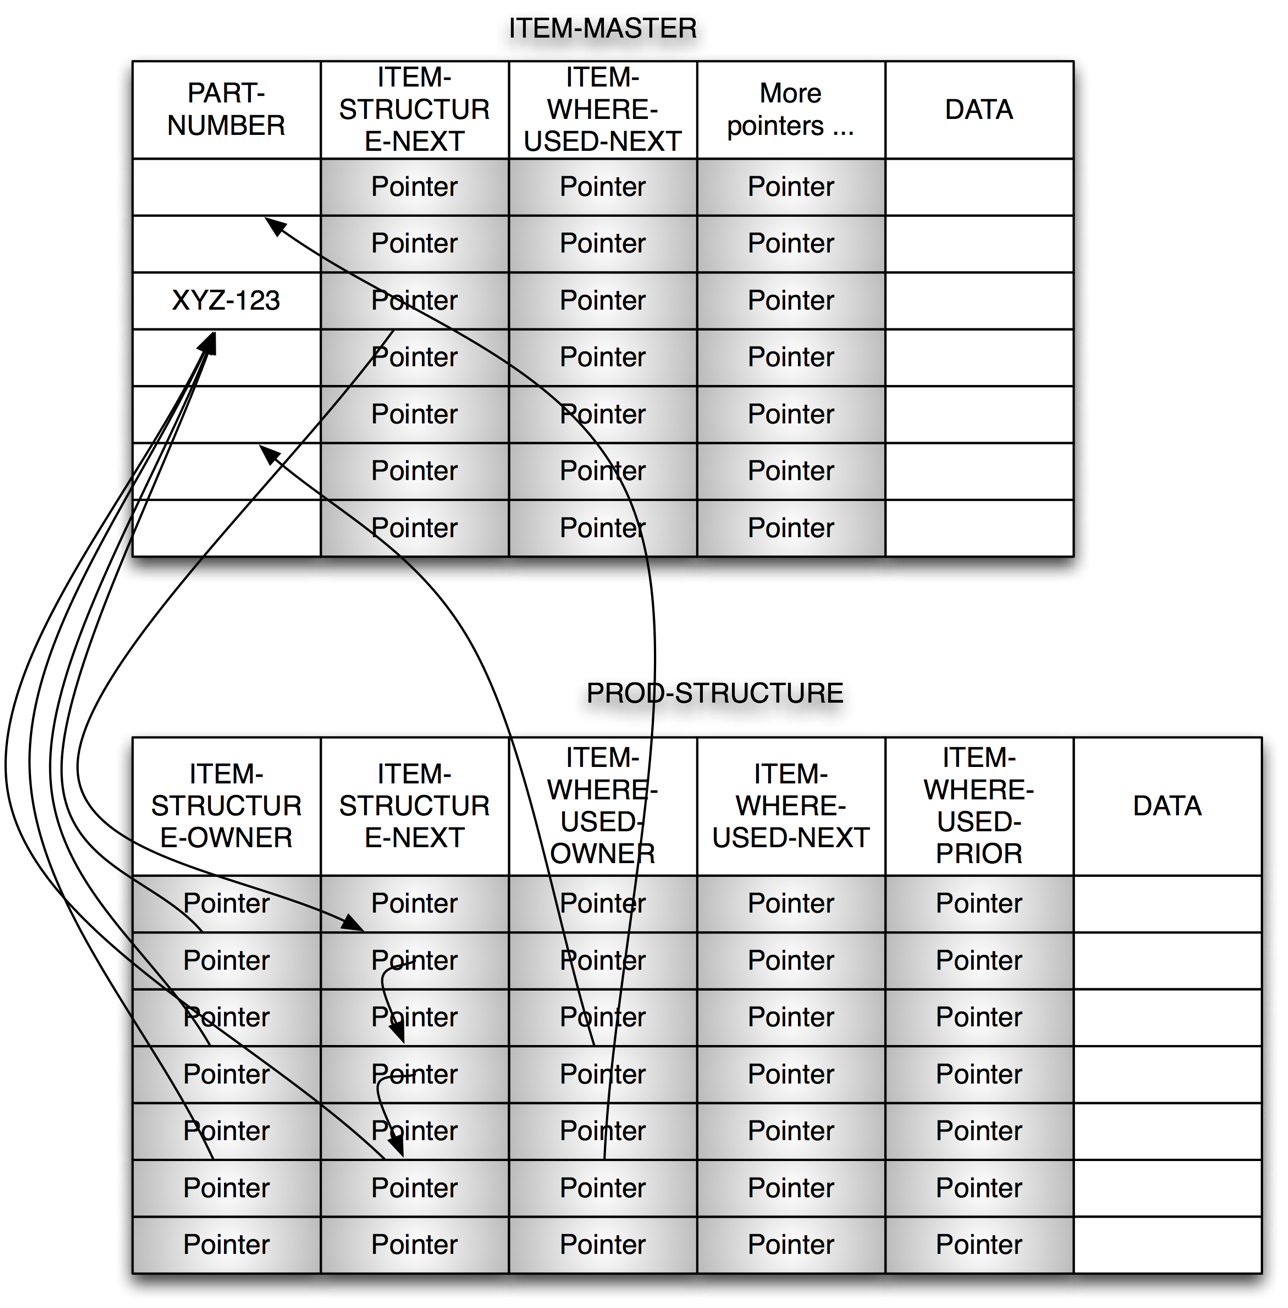
I have only shown a few of the actual relationships that the pointers materialize.
The pointer-based disk addressing made headway into later DBMS-products, including IDMS and Total. Pointers at that time tended to be rather physical, which meant that you risked serious data corruption in case of e.g. somebody pulling the power plug of the disk drive.
However, the pointer still lives on (in a non-physical, key/value manner) today in the many graph DBMS’s.
Episode 2: The Programmer as Navigator
The 1973 Turing award lecture (Communications of the ACM, Vol. 16, No 11, November 1973), was given to Charles M. Bachman, the inventor of the first database system (1964), the Integrated Data Store, I-D-S, running on General Electric (later Honeywell) mainframes. He described the transition from sequential processing to new opportunities coming from the introduction of the random access disk storage devices. The title of his talk was “The Programmer as Navigator”. Primary Data Keys were the principal identifiers of data records, but Secondary Data Keys were also employed.

Besides records and keys, Charles Bachman chose the context of the set (for relationships). Not in the strict mathematical sense, but simply on the logical level, that of having a database with a Department-Employee set which consists of sets of Employees working in the Departments.
The physical model was based on “Database keys”, which were close to physical pointers (using one level of mapping in a page/index structure) to the target record, or the originating record, for that matter. Relationships (“sets”) would be implemented with forward (NEXT) as well as backward (PRIOR) and upwards (OWNER) pointers using the aforementioned database keys.
Hence the notion of the programmer as navigator. Navigating sets either forwards or backwards or climbing hierarchical relationships. The paradigm was called the “network database” at that time.
Charlie Bachman actually invented the first kind of entity-relationship modeling. He called it a Data Structure Diagram. The version below is the version that was/is used with the IDMS database system, one of the handful of CODASYL network database systems, which appeared around 1970.
The “network” database paradigms explained above were standardized by a committee called CODASYL (Conference on Data Systems Languages) in 1966.
The major drawback of IDMS from a practical point of view was that of broken chains in case of a power failure. That meant manually repairing pointer chains…sometimes in the middle of the night. I know – I was in IDMS tech support and I got those phone calls!
Episode 3: Chen, Entities, Attributes, and Relationships
The network databases (like IDMS and Total) fit nicely with the emerging Entity-Relationship data model paradigm (Peter Chen, ACM Transactions on Database Systems Volume 1 Issue 1, March 1976).
Chen became the father of much of the entity-relationship data modeling over the years.
The diagram below is a Chen-style Entity Relationship data model of Departments and Employees based on examples found in his ACM article mentioned above. Note that not all attributes are included (for space-saving reasons).

Notice that in the original Chen-style, the attributes are somewhat independent and the relationships between entities are named and carry cardinalities.
There is no doubt that Peter Chen wanted the diagrams to be on the top level, business facing (i.e. what was then known as conceptual models). I like the explicitness of classic Chen modeling. Attributes are related to their “owner table” in what undoubtedly is a functional dependency.
Actually, Peter Chen went all the way to the “binary level” before constructing his Entity-Relationship paradigm from those bottom-level drawings, something like this:

Chen’s diagram above is, in fact, a directed graph representing a piece of a data model at the most “atomic level”. And Chen’s work really is quite similar to the graph models we will look at later. Graph was close to data models for the first time.
But then came SQL.
Episode 5: SQL and Bill-of-Materials Processing
Ted Codd, the inventor of the relational model published initially in 1970, spent a lot of energy of arguing against having pointers in databases. Admittedly, some of the physical implementations of pointers had some serious drawbacks (“broken chains”).
Never the less, pointers are here to stay. Today they proliferate corporate, relational, databases under the disguise of “surrogate keys”.
“Relational” slowly materialized as SQL, which first appeared in 1974 and became a standard as late as in 1986. Ted Codd got his well-deserved Turing award in 1981. Note that SQL was more an IBM thing than something that Ted Codd designed.
SQL was a paradigm shift, indeed. Let us do some Bill-of-Material processing with SQL.
BOM handling is essentially graph traversal, which is standard functionality in Graph Databases. In SQL databases BOM handling requires recursive SQL and that is not for the faint-hearted, as many of you know. Here is an approximate example:

In a best practice (relational) data model the traversal would be based on a surrogate key, probably called “ItemID” or something similar. Surrogate keys are (in principle) keys, which only carry information about relationship structure. So they are pointers, essentially.
With the advent of SQL, the named relationships were not named anymore. Since foreign key relationships are constraints, and constraints may have names in most SQL implementations. It is strange why this happened. From a business semantics point of view, this is a very sad loss of information.
Episode 5: Graph Models
Graphs emerged as data models in the late 1990s. The development took three paths:
- The Semantic Web standards (RDF, OWL, SPARQL)
- Document referencing in Document Databases (like in MongoDB and several other products)
- Pure directed graph technology (like Neo4j and other products)
Not that graphs were new concepts even at that time. Graph theory has been a part of mathematics since 1736! The first paper was written by Leonhard Euler and addressed the now famous military problem of the Seven Bridges of Königsberg.

by Bogdan Giuşcă [Public domain (PD)]
Aiming to solve the optimization problem, Euler designed a network of four nodes and seven edges. The nodes represent the “land masses” at the ends of the bridges, whereas the edges (the relationships) represent the bridges. Working with that particular representation is called “graph traversal” today.
Formal graphs are now part of mathematics and are a well-researched area. In the data modeling community, however, graphs emerged considerably later.
Caveat: the world is full of relationships, and they express vivid dynamics. This is the space that the graph data models explore. If you ask me, structure (relationships) is of higher importance than contents (the list of properties), if and when your challenge is to look at a somewhat complex context and learn the business semantics from it. Visuals are a great help and visualizing structure is the same as saying “draw a graph of it”.
Let us look at a business case (borrowed from www.neo4j.com ) and how it looks in graph:
“Which Employee had the Highest Cross-Selling Count of ‘Chocolate’ and Which Other Product”?
The graph could look somewhat like this:

Formulated in Neo4J’s query language, Cypher, the traversal looks like this:
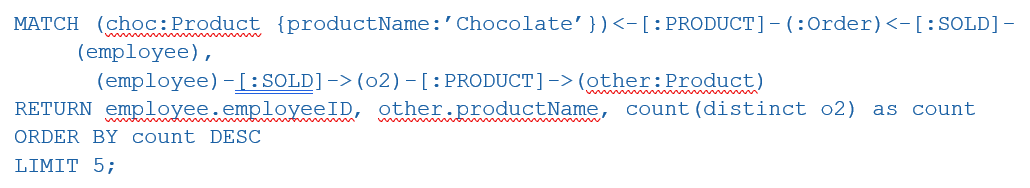
Notice how the path goes from Product via Order to Employee to find the chocolate selling Employees and then back via Order to Product to find those other products. “o2” is just a labeling (a variable name) of what we later want to count.
Relationships are basically connections, but they can also carry a name and some properties.
The property graph data model is a simple, powerful general purpose data model. It is for those reasons that I recommend to use it as a generic representation of any data model.
Coming Full Circle: Tying the Pointers Together
Can we use pointers in today’s Graph Databases? I did a little experiment using Neo4j. And I was able to set up a little data model containing Parent and Child as well as three named relationships:
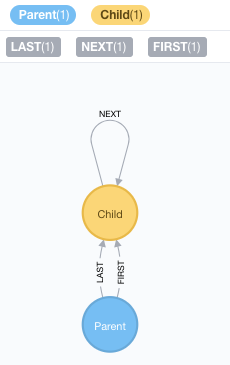
I then added just a little bit of data, and got this graph:

This now gives me the opportunity of reading the little set of data either forwards or backwards:

But, wait, the semantics are slightly different today. Yester decades’ “forwards” and “backwards” meant exactly that. The result set was delivered, one record at a time, in the order that the records were chained together. Today cursor-based delivery is not used that much; much has been packed away in “pagination” mechanisms in code and in platforms.
The Business Semantics of Pointers
So, are there any useful semantics of “next”, “prior”, “first” and “last”, even today?
I think so. First of all, these concepts smell very much of time series, time-ordered events and the like. And obviously you can come along way with “chained” events as outlined above. But you can do that too using ORDER BY backed by a good index. And there are also temporal designs, as-is/as-of, data vaults etc.
But, if the connectedness is on the high side, graph data models are superior performers. Which means that for some classes of business contexts “chains” (graph-based relationships) will offer top performance based on an intuitive data model.
First and last offer special opportunities. Some use cases (versioned data, for example) ask for complete, time-stamped, version history. But 90 % of all access is to the current (latest) version. A quick “first” or “last” (“pointer”) will beat the overhead of a large index responsible for the sorting of the events and for doing efficient “max(transaction_date)” selection to get the latest transaction within a position in a portfolio, today (for example).
There are also use cases where ORDER BY is not sufficient. Order may potentially only be maintained by business logic and is not always in ascending order. Late arriving facts (like corrections of historical data) is a good example.
And of course, “next” and “prior” are just generalized cases of specific relationship types. Actors acting in movies may be grouped by an “acted in” relationship, which has richer business semantics than “next”. That is the real power of the labeled property graph data model.
Don’t shy back from pointing at things! Do it as you find appropriate.