Click to learn more about author Thomas Frisendal.
Happy Days Are Here Again! At least for all of us, who get a kick from new data base technologies. This is much like the repeal of probation in the 1930es (where “Happy days are here again” was a new and popular song). These days the V-commandments of Big Data have opened up the doors to diversity and rather incompatible paradigms such as: Key/Value stores, incl. columnar or long rows, hierarchical storage like aggregates or collections and, last but not least, Graph Databases. Oh, and yes, there still are valid use cases for (almost) normalized SQL tables!
The name of the game is mix and match. Hybrid solutions are OK. Redundancy is OK.
But how about looking across all that data?
Traditionally we have used data models to supply the much needed understanding of the structure and the meaning of the data. But today there are still no well-established modeling tools for looking across data stores of incompatible designs – even though they might contain parts of the same corporate data in overlapping fashions. “Polyglot data model visualization” is up for grabs. How do go about tackling this challenging opportunity?
I say we need something like a Swiss army knife to handle the kind of data model representation, which can unify and integrate the underlying data models at least on the visual level. Obviously such an app would work from a leading edge data catalogue.
Such a Swiss army knife exists, if you ask me
The Property Graph Data Model Meta Model
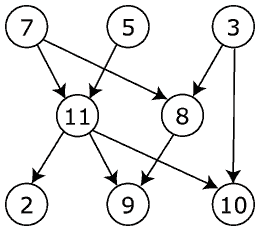
“Graph” is a mathematical concept, which was first described in 1736 by Euler. Do not think about pie charts, the picture in your head should look like this:
(Public Domain, https://commons.wikimedia.org/w/index.php?curid=614057)
What such directed graphs do very well is representing connected data. Describing the real world is about communicating these two perspectives:
- Structure (connectedness) and
- Meaning (naming and other definitions)
So, even if your physical target is not a Graph Database, borrowing the paradigms of the (property) graph to make platform independent representations of data models makes perfect sense.
At the bottom of this page you will find references to the theoretical background of property graphs. For now, think about property graphs as being mathematically well-founded (graph theory). Just as the relational model (in the Dr. Ted Codd style) is based on mathematics (set theory). Going graph does not imply lack of precision.
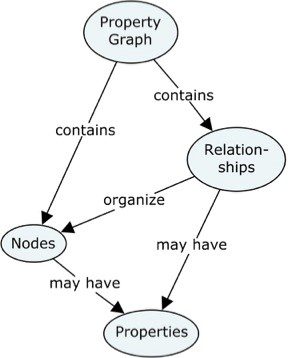
The concept map below explains the most important concepts used in the property graph context:
Both Nodes and Relationships can (should) have “names” (formally called labels for nodes and types for relationships), just like concepts and their relationships have in the diagram above.
Relationships are directed, which is visualized by the arrowheads.
Both Nodes and Relationships may be associated with Properties, which are “key / value” pairs such as e.g. Color: Red. On the data model level, we call the key “Property Name”.
The labeled property graph model is the best general purpose data model paradigm that we have today.
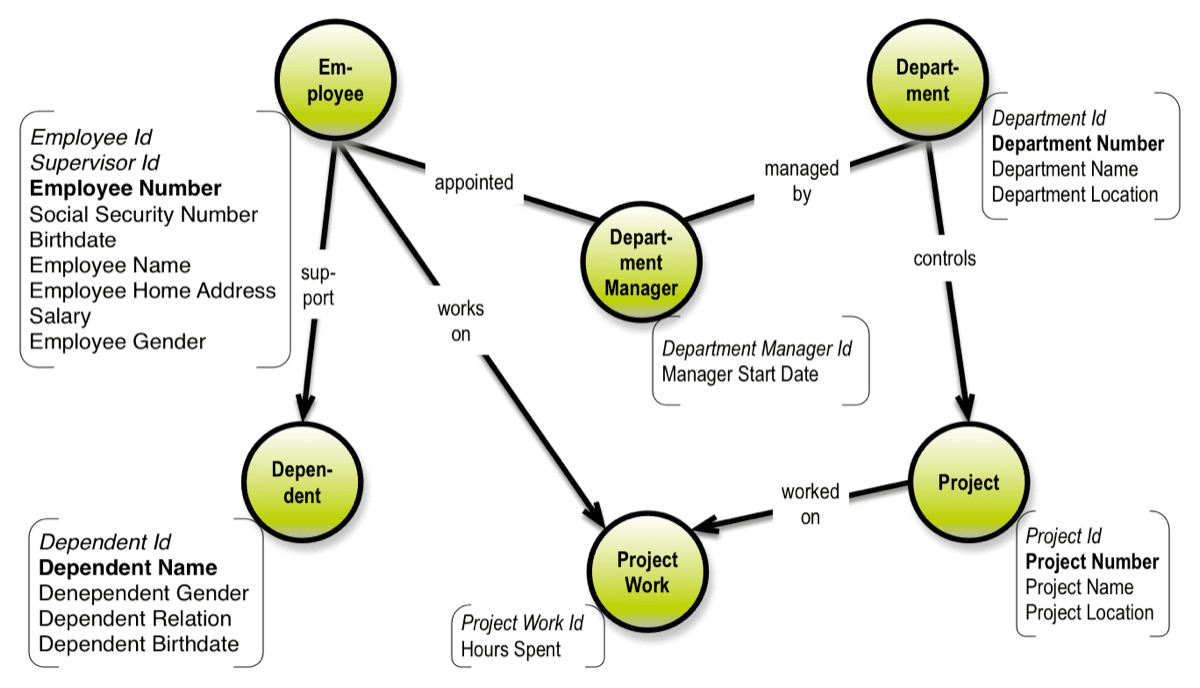
The important things are the names and the structure (the nodes and the relationships). The properties supplement the solution structure by way of adding content. Properties are also basically just labels, but they can also signify “identity” (the general idea of a key on the data model level). Identities may be shown in italics (or some other special effect to your liking). And uniqueness can be signaled using bold font, for example (based on one of Peter Chen’s early data models):
For more details about this way of diagramming see my book about Graph Data Modeling.
Challenges When Looking Across
A good example of the challenges involved in looking across is the matter of hierarchies. These exist on the business level, and can be recognized in concept models and in (normalized) logical data models.
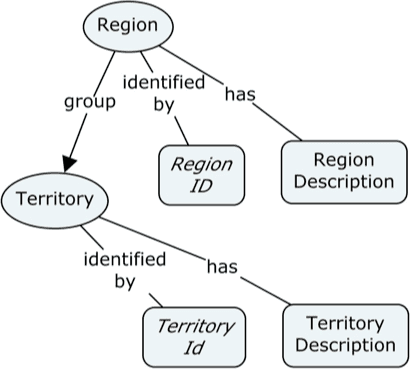
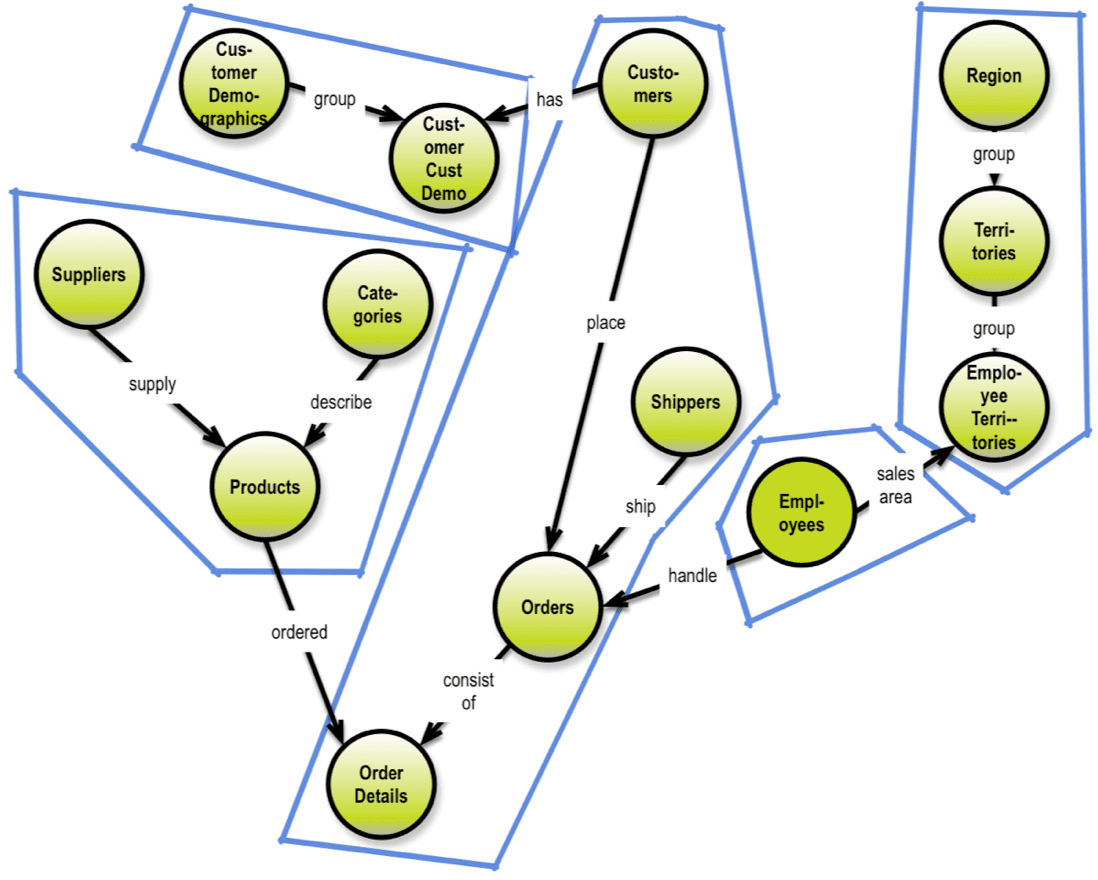
However, denormalize with a smile, must we. Denormalization and duplication are your good friends. To denormalize effectively, you’ll need to understand the business level concepts involved in classification hierarchies and the like. Here is an example of a concept model (originating from the Microsoft Northwind example):
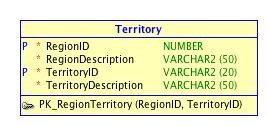
A denormalized SQL table of the above would look something like:
In Data Warehousing, we learned to denormalize without hesitation. Even in traditional normalized methodologies, modelers are often encouraged to denormalize for performance as the last step. It can’t hurt, and for some physical data stores, it is a necessity.
Denormalization also introduces another basic violation of the normalization principles: the constructs called “repeating groups.” We see them all the time, a customer might well have more than 2 telephone numbers. The list of telephone numbers is a repeating group.
Note that denormalization can be used in different situations:
- Defining key/value structures, possibly containing multiple keys and/or multiple value columns and/or
- Building concatenated data (e.g. JSON) to be used in single-valued key-value stores (also called “wide column stores”) and/or
- Building aggregates in the sense used in Domain Driven Design and/or
- Building nested sets for document style collections.
Denormalization will have to cater to that. For example, sketching an aggregate structure on top of a property graph model will look like this:
Aggregates essentially deliver hierarchies for each relevant sub-tree of the solution data model. Note that aggregation might imply denormalization as well; the result will always have redundant data. Consider this when designing your model. If the redundant data is processed at different stages of a lifecycle, it might work well.
JSON and GraphQL are exploiting graph traversal in similar manners to the visualization above. In GraphQL, for example, you can define queries containing repeated data across multiple (Relay) connections or relationships. Everything is trees and the redundancy is there with the purpose of supporting a tree structure derived from a network.
The considerations for delivering data models for document stores are very similar to those for delivering aggregated data models, as described in the preceding section. The term “collections“ is often used to refer to a collection of data that goes into a separate document.
Many document stores offer flexibility of choice between embedding or referencing. Referencing allows you to avoid redundancy, but at the cost of having to retrieve many documents. In fact, some products go to great lengths to deliver graph-style capabilities, both in the semantic “RDF triplets” style and in the general “directed graph” style.
This brings us to the graph kind of paradigms.
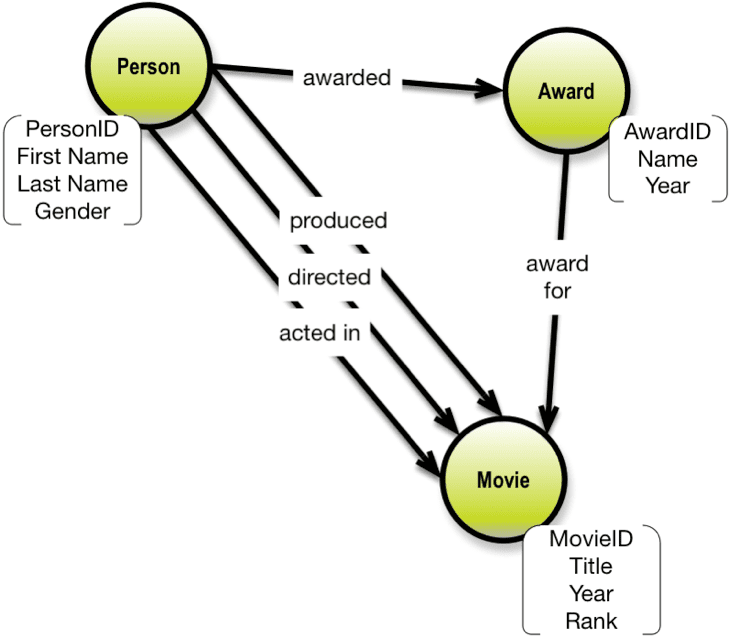
Morphing a property graph model into a triple store solution for a RDF database is rather easy on the structural level. It basically involves a serialization of the concepts behind the graph data model, supplemented with solution-level keys and properties if necessary.
Here is a simplified solution data model modeled after the Internet Movie Database (www.imdb.com):
If you start by way of white-boarding a property graph data model, this, of course, makes moving it to a property graph database (such as Neo4J) very easy.
Much of the flexibility of the graph model can be used to handle specialization on the fly. That is fine in most cases, but specializations hang off more precisely defined structures. And the precisely defined structures is what you should have in your final data model.
In physical graph databases you can use ordered, linked lists. Neo4j mentions (in an article) two examples of such lists:
- A “next broadcast” relationship, linking the broadcasts in chronological order
- A “next in production” relationship, ordering the same broadcasts in sequence of production.
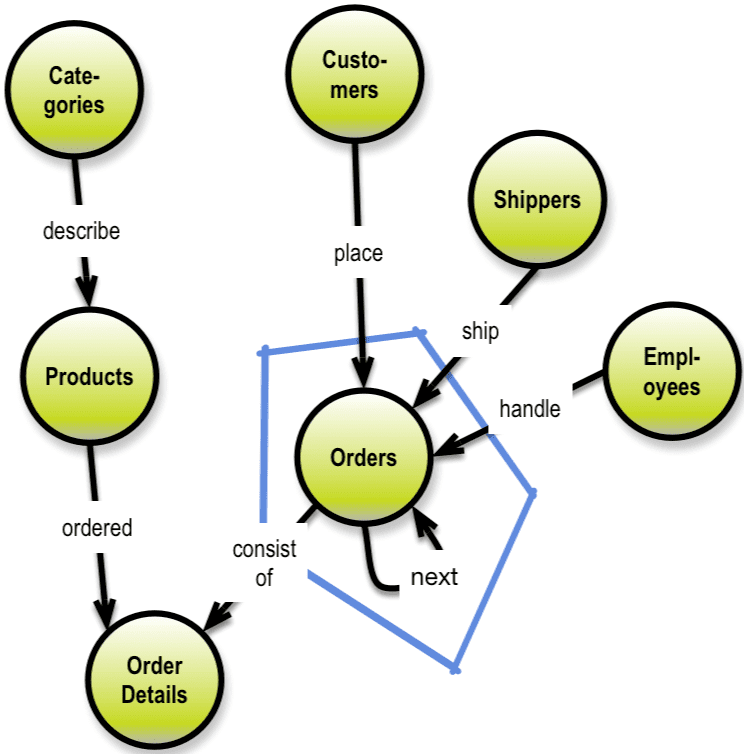
Here is an example of establishing purchasing history for customers by way of using a “next order” relationship:
Prior links could also be useful in situations like this.
In this manner time-series data can be handled elegantly in graphical representations using next / prior linking.
Enhancing an agnostic data model to take advantage of a physical property graph platform is very easy. There are some physical aspects, which should be taken into consideration:
- Uniqueness and identity
- Data types
- Properties on relationships
- A relationship may point to different types of business objects, like when “Part” and “Waste” are both “part of.” This is both a strength and a weakness. Strength because it reflects the way people think about the reality. And a weakness because people might get confused, if the semantics are unclear. These considerations are very good reasons for defining a solution data model, even if your physical data model is going to be based on a “flexible” or even non-existing schema.
- Ordered, linked lists; possibly including time-series, which can also be handled elegantly in a graph representation (such as e.g. a relationship of type “next” or “previous”).
The Graph Data Modeling book and Neo4J’s homepage (and several other graph database homepages) have lengthy discussions of these physical aspects of graph technology, which are actually rather difficult to accomplish in other technologies such as SQL tables. Good thing that there are room for solutions without tables, if I may put it that way. I strongly recommend graph technology for business problems having a high degree of connectedness.
What about SQL as target model? Transforming a data model from a property graph format into a relational data model using SQL tables is straightforward. Each node becomes a table, and the identity fields and the relationships control the primary / foreign key structures.
With this round trip of property graphs as the “mother data model” for many possible physical data models, I rest my case. I hope you made notes of the flexibility of the property graph meta model as being a handy Swiss army knife of anyone having to care about structures within data. And I do hope that graphs look appealing to you for many kinds of solutions.
Oh, and one more thing:
Graph Theoretical Background
For the mathematically savvy readers here is some non-fake facts about graphs.
On the Github site for the OpenCypher project you can find a good, formal definition based on mathematical graph theoretical concepts. Basically a property graph in the sense it is used here is a directed, vertex-labeled, edge-labeled multigraph with self-edges, where edges have their own identity. In the property graph paradigm, the term node is used to denote a vertex, and relationship to denote an edge. See Wikipedia’s definitions for reference:
The Apache Tinkerpop ™ project is also based on very similar concepts.
There are several physical implementations of property graph technologies. One of the most well know is Neo4J from Neo Technologies, most of the rest of the companies are listed on the Tinkerpop site. Neo has a good introduction to property graphs over here: https://neo4j.com/developer/graph-database/

