Click to learn more about author Steve Miller.
It’s Fall championship time for NCAA D1 college sports. On Sunday 12/3, college football announced its final four to commence New Year’s day, and other championship tournaments such as men’s and women’s soccer and women’s volleyball are currently in progress.
A major challenge before the start of any NCAA tournament is to determine which 16, 32, 48, or 64 teams from regular season play should be invited — and also to decide how these teams should be ranked or seeded to comprise fair and competitive brackets. There’s certainly no shortage of sports analytics methodologies to provide assistance in the process. Over the years, a measure known as ratings percentage index, or rpi has assumed a significant role in ranking college sports teams. “The RPI is a quantity used to rank sports teams based upon a team’s wins and losses and its strength of schedule. It is one of the sports rating systems by which NCAA basketball, baseball, softball, hockey, soccer, lacrosse, and volleyball teams are ranked.” An important analytic feature of RPI-like statistics is that they rank all competitors, not just the top teams, and thus provide the grist for comprehensive performance evaluation. Not surprisingly, there are variants of RPI that purport to even better discern team performance.
A key factor in determining a team’s strength of schedule/RPI is the quality of the conference that it competes in. In women’s volleyball, for example, there are 32 conferences housing D1’s 334 teams. The major national university conferences such as the Pac-12 and the Big Ten generally play at a higher level than smaller school conferences like the Mid-Eastern and Southwestern, so RPI’s end up being significantly related to conference affiliation. Playing 20 games against top conference competition is good for the RPI.
College sports TV talking heads often wax about this conference or that being the best “top-to-bottom”. Yet it’s very difficult for a conference to be solid throughout, since each game has both a winner and loser — or, in the case of soccer, a tie. So if a football team goes undefeated in an eight game conference schedule, there are eight losses to be distributed among other conference teams. An interesting thought experiment is whether a conference is perceptually better off with most teams winning roughly half their games in contrast to extremes of both winners and losers.
A simple approach for evaluating conference performance is to use a measure of power ranking like RPI for each participant and then to aggregate conference scores from those rankings. The statistic I currently deploy is the sum of the power ranks of the top team, along with the 25th, 50th, and 75th percentiles. In this world, only the top 75% of conference teams are considered in the evaluation statistic, though all are included in accompanying graphics.
To compute these conference scores, it’s necessary to have data indicating team, conference, and a measure of RPI for all participants. Fortunately, such data is commonly available through the NCAA, ESPN, and other sports sources and can be scraped from their websites. Once conference scores are calculated, basic statistical plots like the violin can readily display ordered distributions of RPI performance by conference. The remainder of this blog looks at 2017 NCAA D1 conference performance in women’s volleyball, football, and men’s soccer using the R statistical computing system.
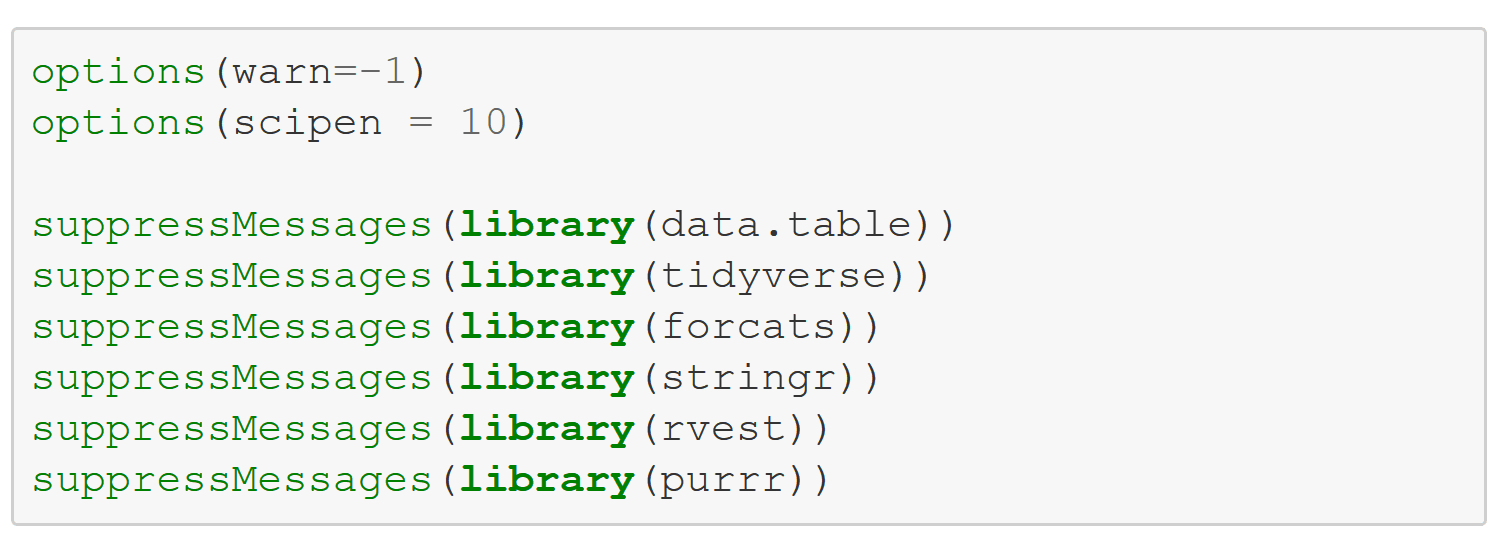
To start, set a few options and load several R Data Management and graphics packages.
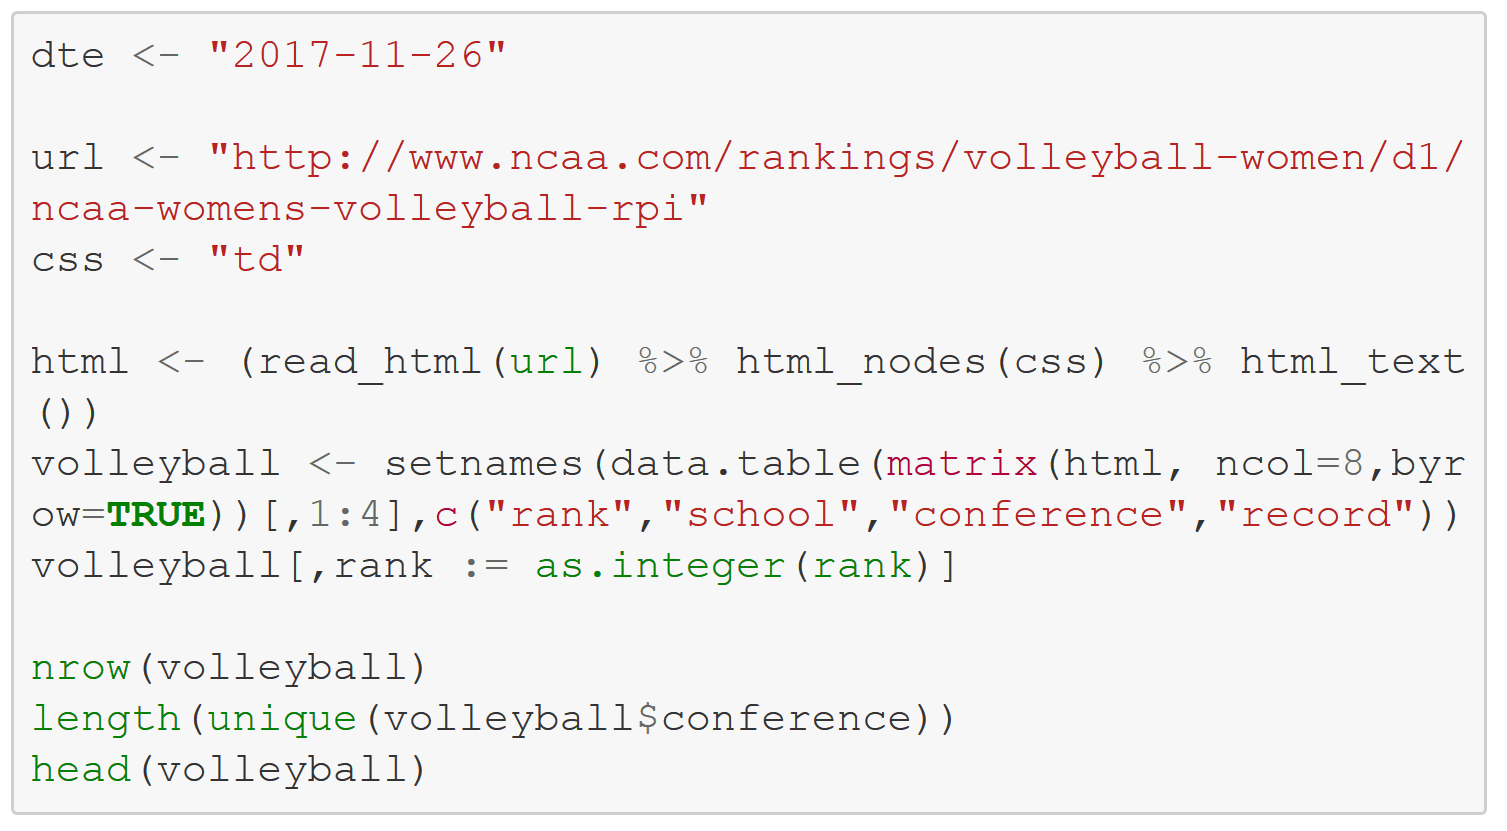
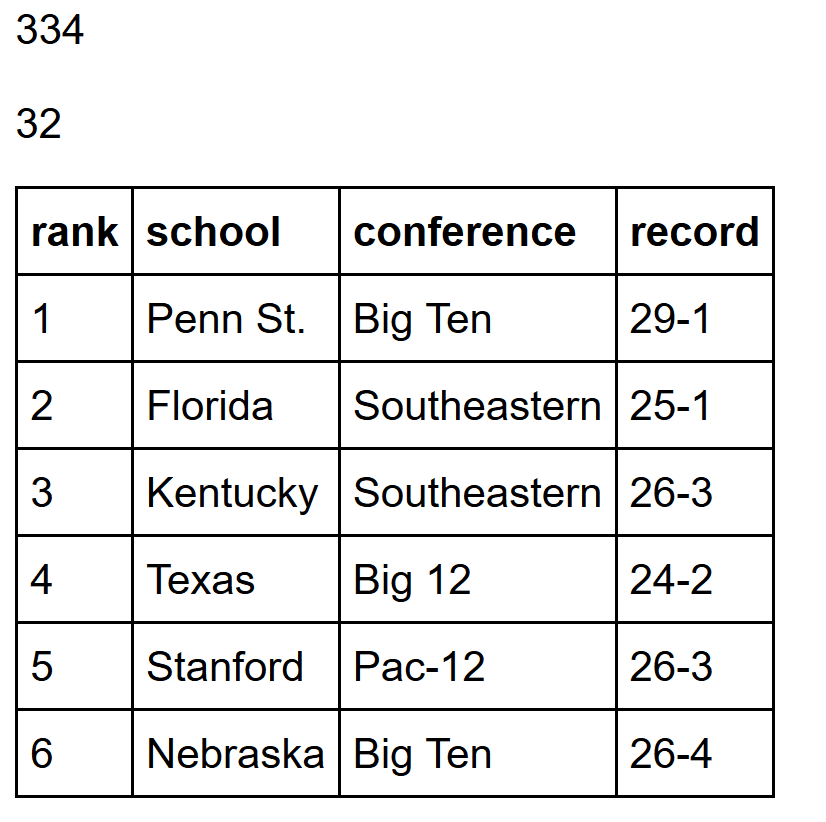
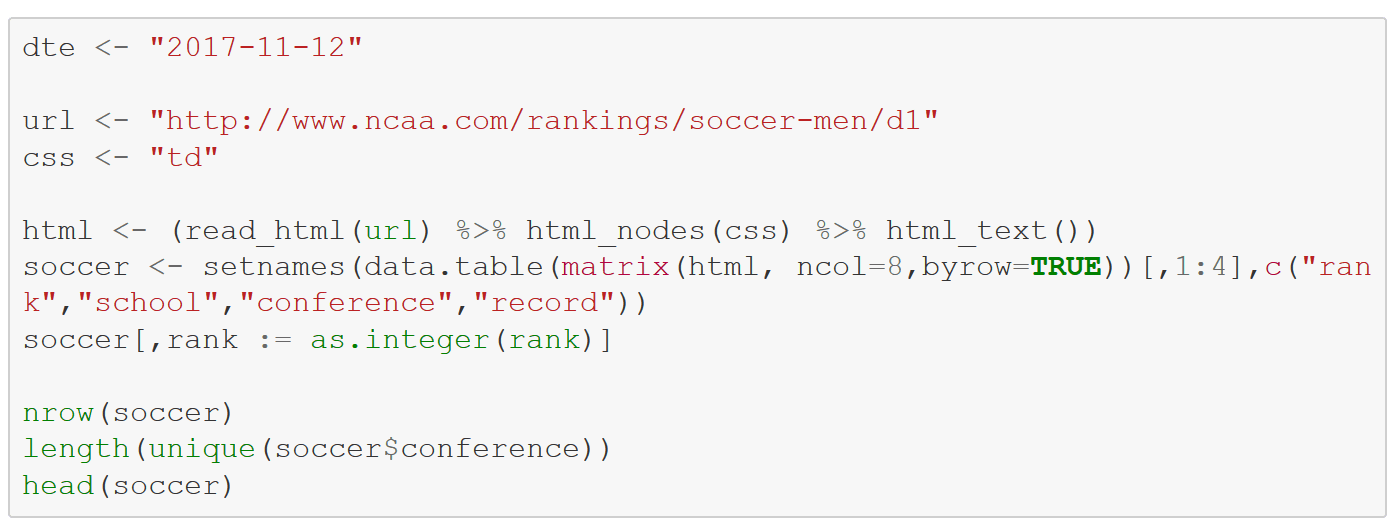
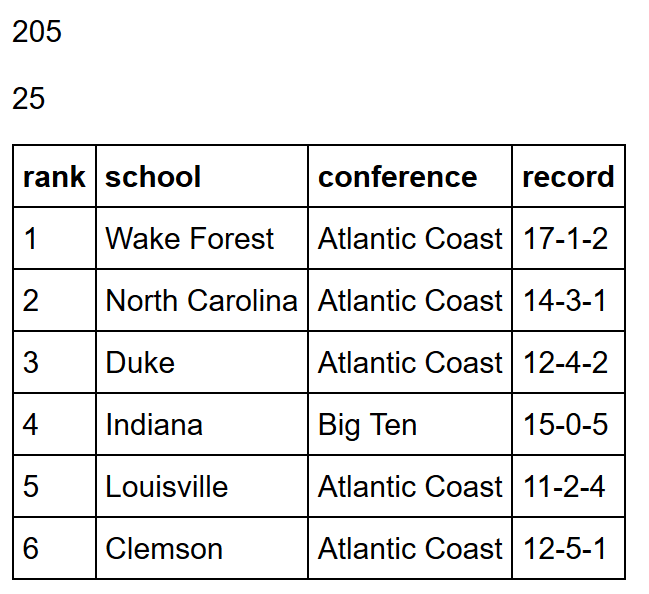
First consider women’s volleyball. I use the R rvest package to scrape the table from the vball website, then rehape the results into an R data.table. The rankings are through games of Nov 25. There are 334 D1 teams representing 32 conferences in 2017.
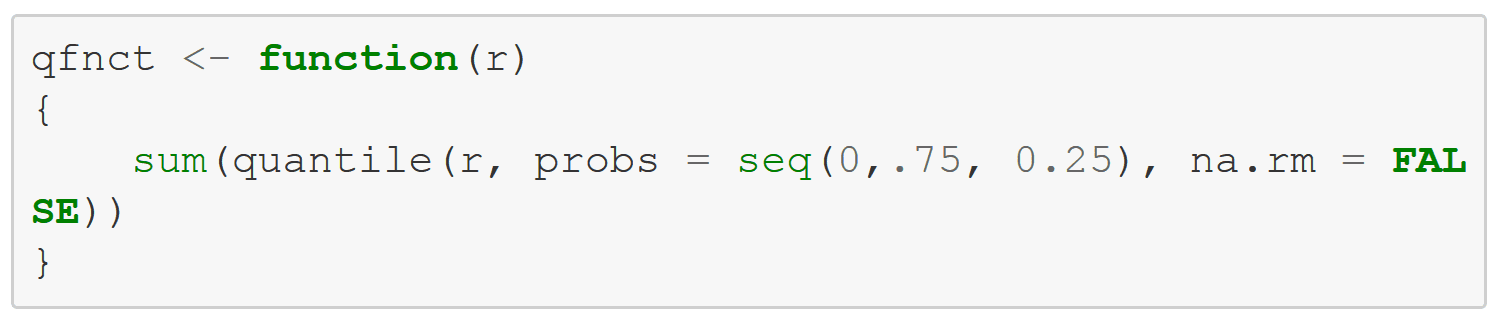
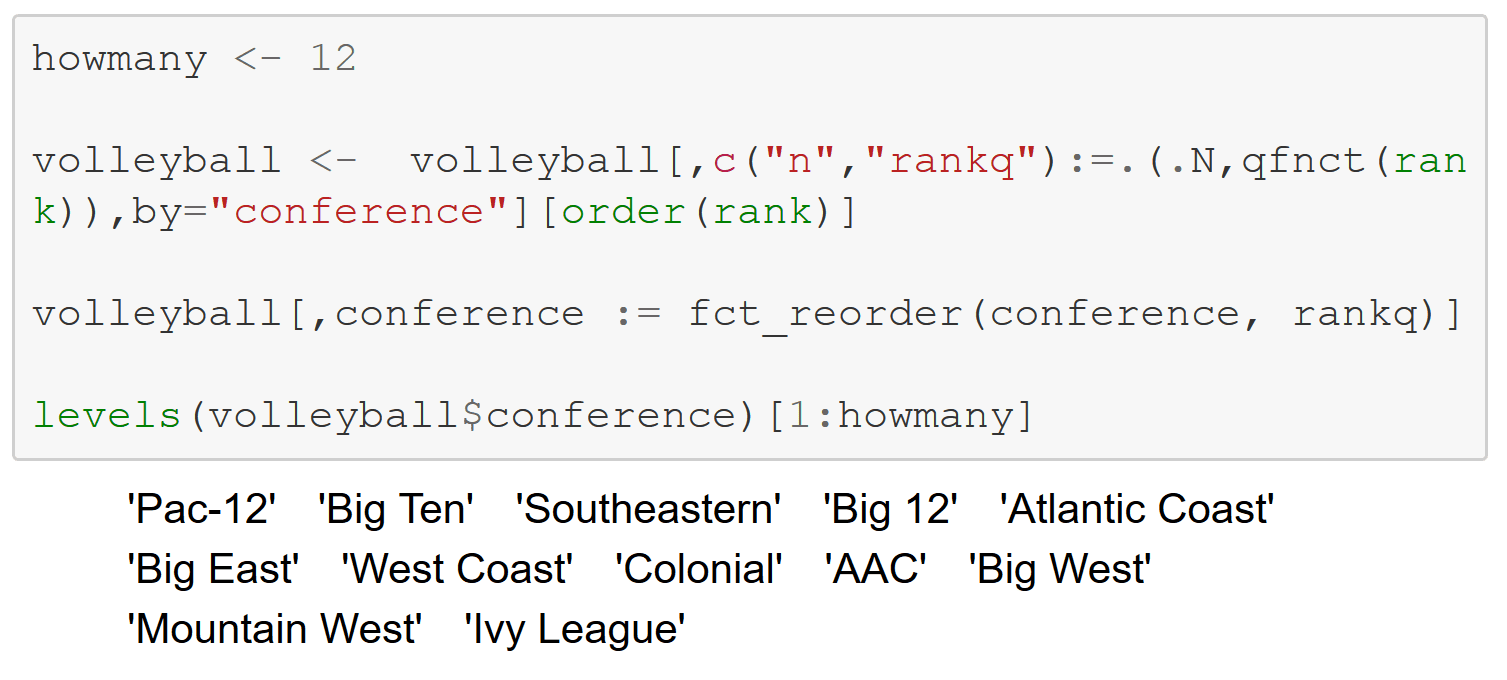
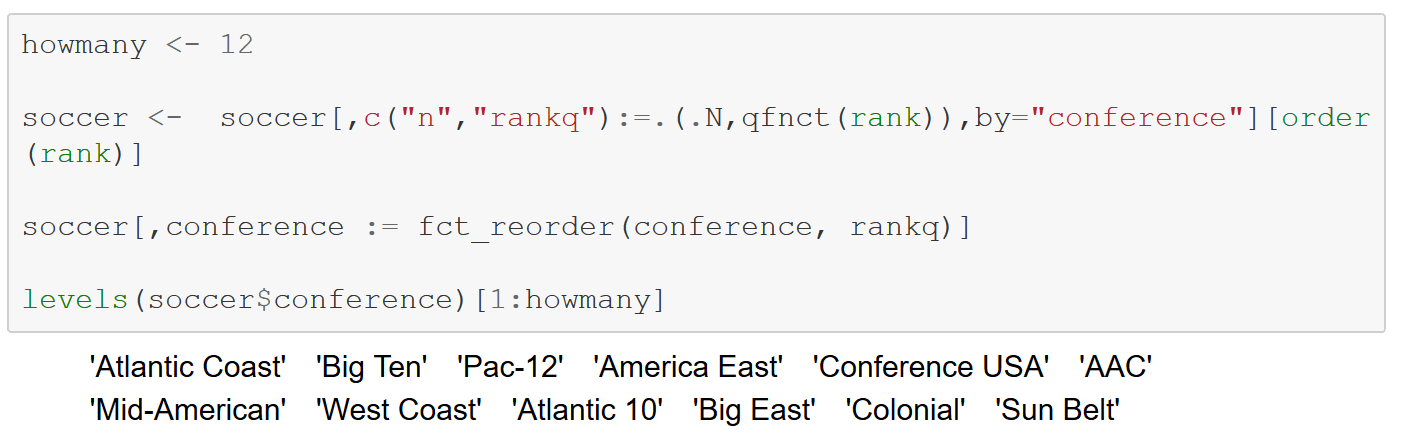
qfnct is the function that assigns each conference a performance score based on the RPI rankings of its teams. That score is the sum of the ranks of the conference’s top team plus its 25th percentile, 50th percentile, and 75th percentile performers. Lower scores are better.
Compute the qfnct scores for volleyball and reorder the conferences — from best to worst. The Pac-12 and the Big Ten are the top performers as of 11/26.
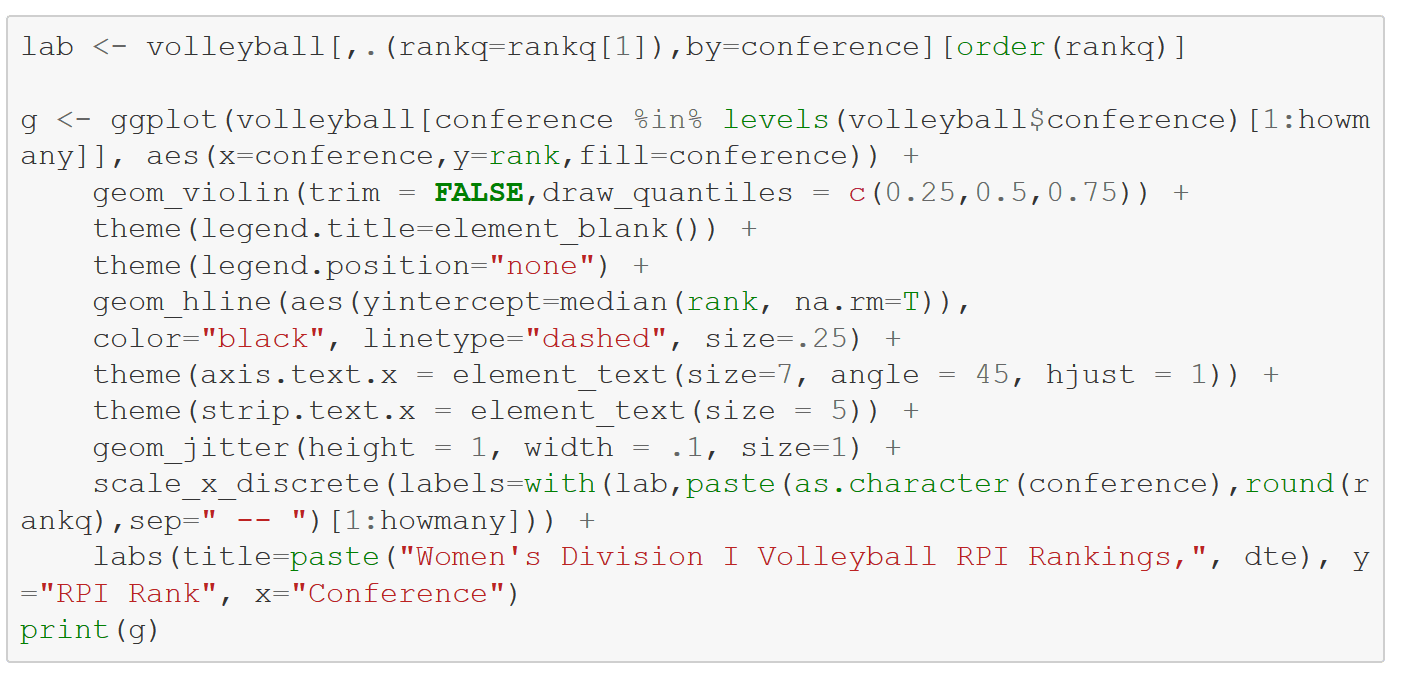
Display the top 12 conferences using a violin plot from R’s ggplot2 package to show the distributions along with the jittered raw rankings. The conference performance score is printed on the X labels. Within each conference violin, the 25th, 50th, and 75th percentile points are indicated by horizontal lines. In this graph, the Pac-12 and Big Ten clearly dominate. Tellingly, the Sweet 16 of the ongoing tournament consists of six Big 10 and five Pac-12 teams.

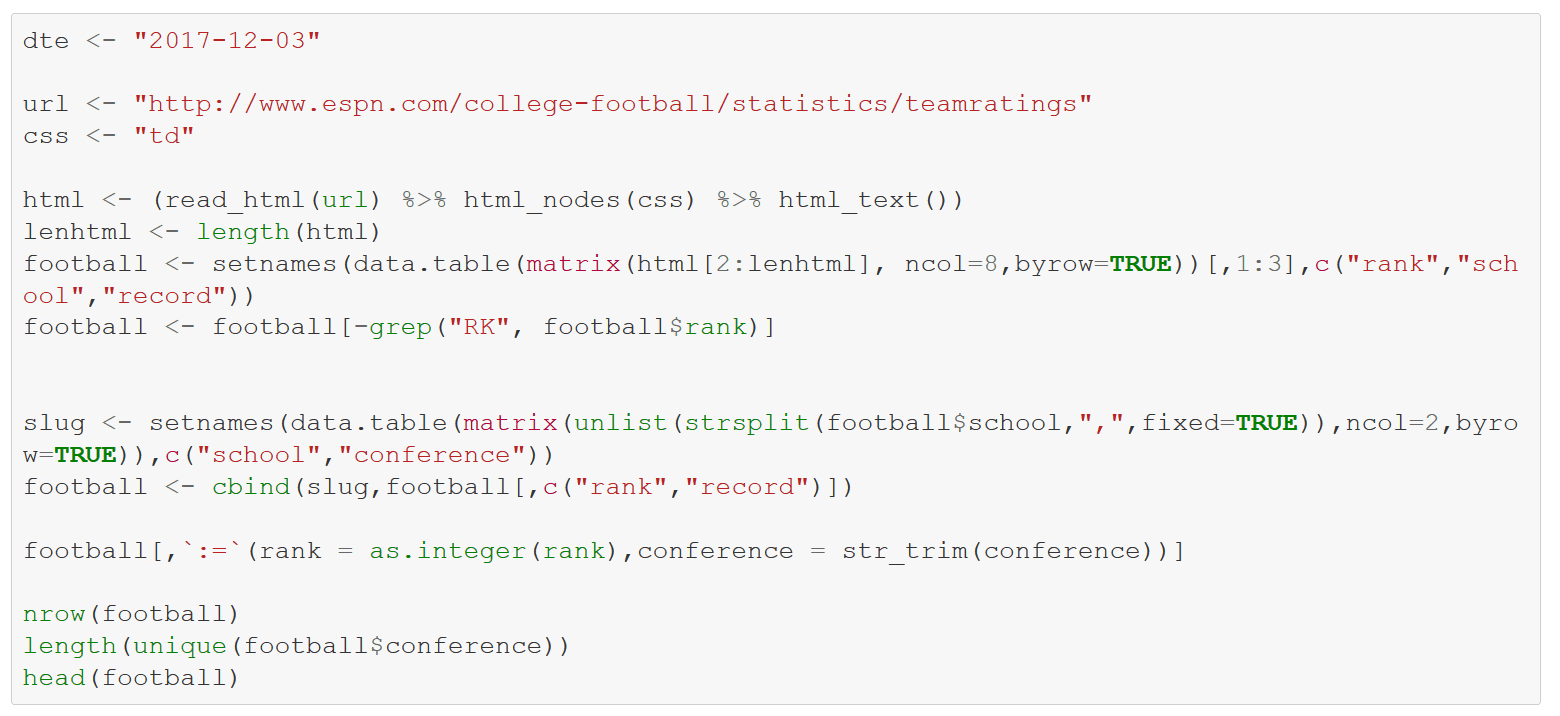
Now switch to D1 football, with power rankings of the top eleven conferences supplied by ESPN. The wrangling work is a bit more complicated than with volleyball. A subsequent cell computes conference scores and reorders accordingly. Note that the vaunted SEC lags the Big 12 and ACC this year with these calcs.


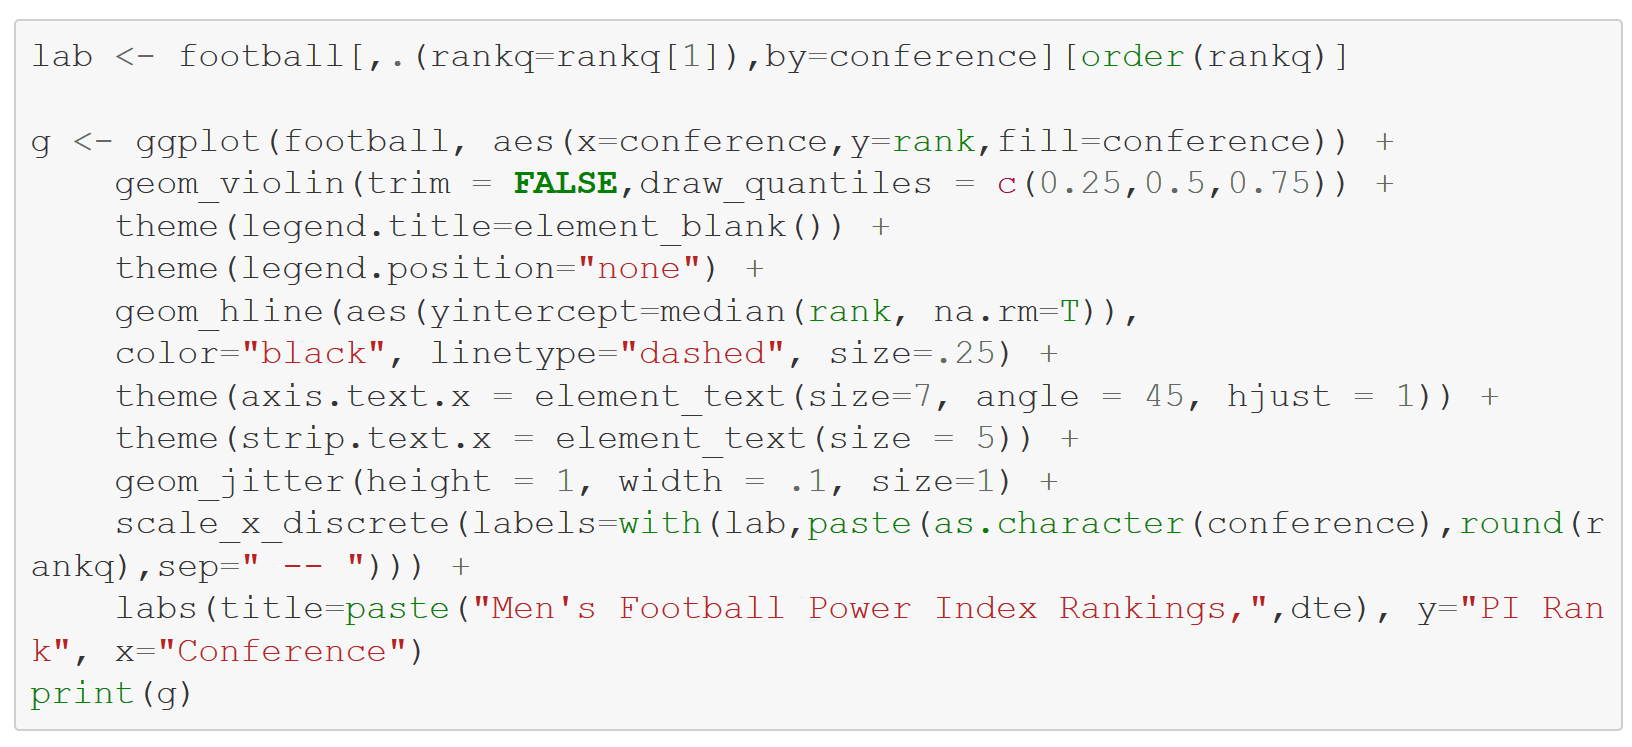
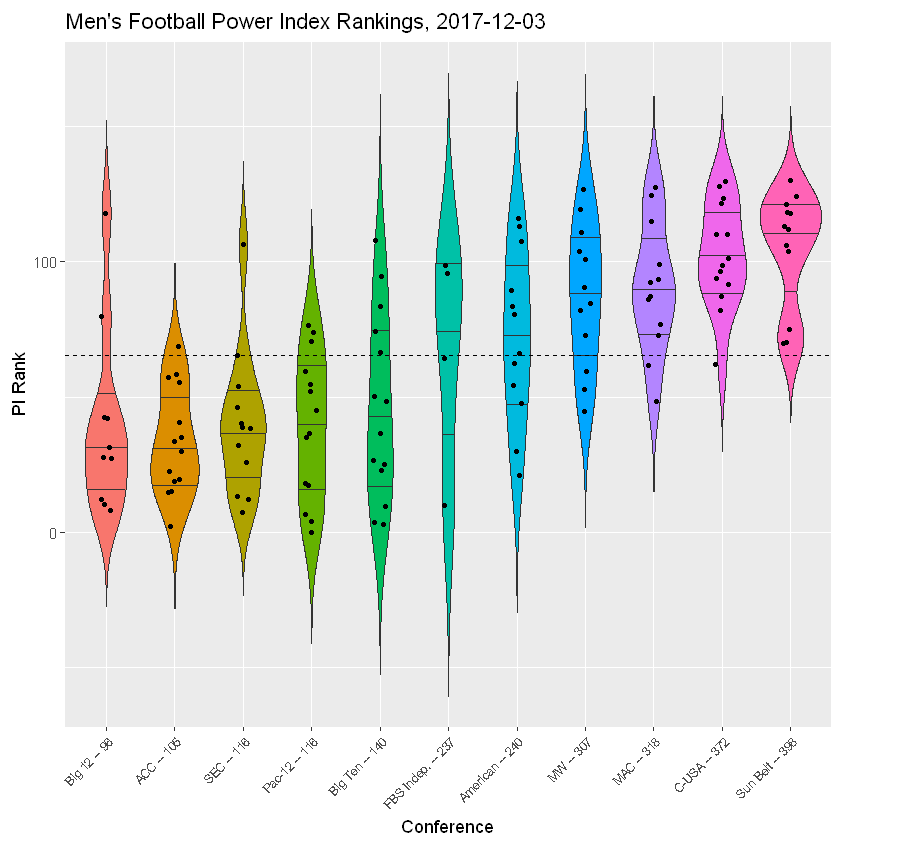
Contrast the power rankings of top conference Big 12 with the 5th-rated Big Ten. With 8 of 10 teams ranked lower than 50, the Big 12 certainly appears to be superior “top to bottom” to the Big Ten, which has just 8 of 14 — though the Big Ten has 3 top 10 teams compared to just 1 for the Big 12.
![]()


Finally, look at D1 men’s soccer. The ACC sits alone at the top, its conference performance score an almost other-wordly 100 points better than the 2nd place Big Ten. Indeed, he ACC 75th percentile is lower than the 50th percentile of any other conference. Eight ACC teams were selected to the NCAA tournament and one has advanced to the final four.


Can’t wait to see how the tournaments play out!