In this article, we are going to explore core open-source tools that are needed for any company to become data-driven. We’ll cover integration, transformation, orchestration, analytics, and machine learning tools as a starter guide to the latest open data stack.
Let’s start with the modern data stack. Have you heard of it or where the term came from?
Here’s the definition from our Data Glossary:
“The Modern Data Stack (MDS) is a heap of open-source tools to achieve end-to-end analytics from ingestion to transformation to ML over to a columnar data warehouse or lake solution with an analytics BI dashboard backend. This stack is extendable, like lego blocks. Usually, it consists of data integration, a transformation tool, an Orchestrator, and a Business Intelligence Tool. With growing data, you might add Data Quality and observability tools, Data Catalogs, Semantic Layers, and more.”
So, what is the open data stack? The open data stack is a better term for the modern data stack, but focusing on solutions built on open source and open standards covering the data engineering lifecycle. It still has the same goal as the modern data stack, but tools integrate better due to the openness and, therefore, it is more usable for data practitioners.

The word “open” is vital here. It means the tool or framework is either open source or complies to open standards. For example, Dremio, a data lakehouse platform, is closed source but based on open standards like Apache Iceberg and Apache Arrow, eliminating vendor lock-in for bigger organizations.
The Open Data Stack
Before we introduce individual tools, let’s consider why you might want to use an open data stack – one that is maintained by everyone using it. With the open data stack, companies can reuse existing battle-tested solutions and build on top of them instead of having to reinvent the wheel by re-implementing key components from the data engineering lifecycle for each component of the data stack.
In the past, without these tools available, the story usually went something like this:
- Extracting: “Write some script to extract data from X.”
- Visualizing: “Let’s buy an all-in-one BI tool.”
- Scheduling: “Now we need a daily cron.”
- Monitoring: “Why didn’t we know the script broke?”
- Configuration: “We need to reuse this code but slightly differently.”
- Incremental Sync: “We only need the new data.”
- Schema Change: “Now we have to rewrite this.”
- Adding new sources: “OK, new script…”
- Testing + Auth + Pagination: “Why didn’t we know the script broke?”
- Scaling: “How do we scale up and down this workload?”
These scripts above were written in custom code dedicated to one company – sometimes one department only. Let’s find out how we profit from the open data stack to have a data stack up and running quickly to solve challenges such as those above.
Note: I am ignoring the rest of the lifecycle that comes with this scenario, such as security, deployment, maintenance, data management, and defining software engineering best practices. I’m also leaving storage out, as it is interchangeable with most of the standard storage layers; I also wrote in-depth about them in the Data Lake and Lakehouse Guide.
The core tools I present here are my personal favorites. But since there are over 100 tools to choose from, I want to offer a beginner’s guide if you haven’t had an opportunity to study the field closely.
Data Integration
The first task is data integration. Integration is needed when your organization collects large amounts of data in various systems such as databases, CRM systems, application servers, and so on. Accessing and analyzing data that is spread across multiple systems can be a challenge. To address this challenge, data integration can be used to create a unified view of your organization’s data.
At a high level, data integration is the process of combining data from disparate source systems into a single unified view. This can be accomplished via manual integration, data virtualization, application integration, or by moving data from multiple sources into a unified destination.
My own company has a large community that updates connectors when source APIs and schemas change, allowing data teams to focus on insights and innovation instead of ETL. With open source, you can edit pre-built connectors and build new ones in hours.
How to Get Started
It’s super-simple: you type two lines of code in your terminal and get an up-and-running UI (more on docs):
“`sh
git clone https://github.com/airbytehq/airbyte.git
cd airbyte && docker-compose up
“`
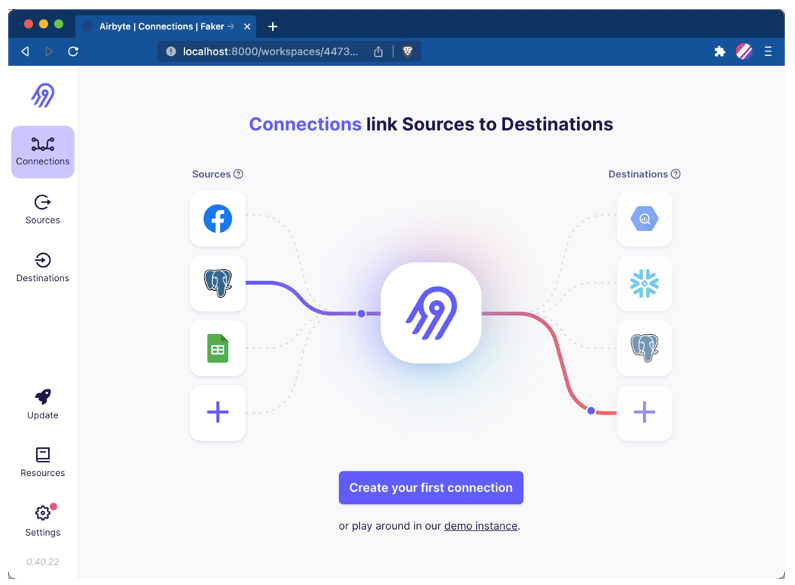
You can also play around on the demo instance.
Data Transformation (SQL)
The next step is data transformation. Data transformation is the process of converting data from one format to another. Reasons for doing this could be to optimize the data for a different use case than it was originally intended or to meet the requirements for storing data in a different system. Data transformation may involve steps such as cleansing, normalizing, structuring, validation, sorting, joining, or enriching data. In essence, the key business logic is saved in the transformation layer.
Every data project starts with some SQL queries. One of the most popular tools for this step is dbt, which immediately allows you to use software engineering best practices and added features that SQL does not support. Essential elements are documentation generation, reusability of the different SQL statements, testing, source code versioning, added functionality to plain SQL with Jinja Templates, and (newly added) even Python support.
dbt avoids writing boilerplate DML and DDL by managing transactions, dropping tables, and managing schema changes. Write business logic with just a SQL select statement or a Python DataFrame that returns the dataset you need, and dbt takes care of materialization.
dbt produces valuable metadata to find long-running queries and has built-in support for standard transformation models such as full or incremental load.
How to Get Started
dbt is a command line interface (CLI) tool that needs to be installed first. Choose your preferred way of installation. To initialize, you can run the command to set up an empty project: `dbt init my-open-data-stack-project`.
Next, you can start setting up your SQL statement into macros and models, where the macros are your SQL statements with extended Jinja macros and the models are your physical elements you want to have in your destination defined as a table view (see image below; you can specify this in `dbt_project`.
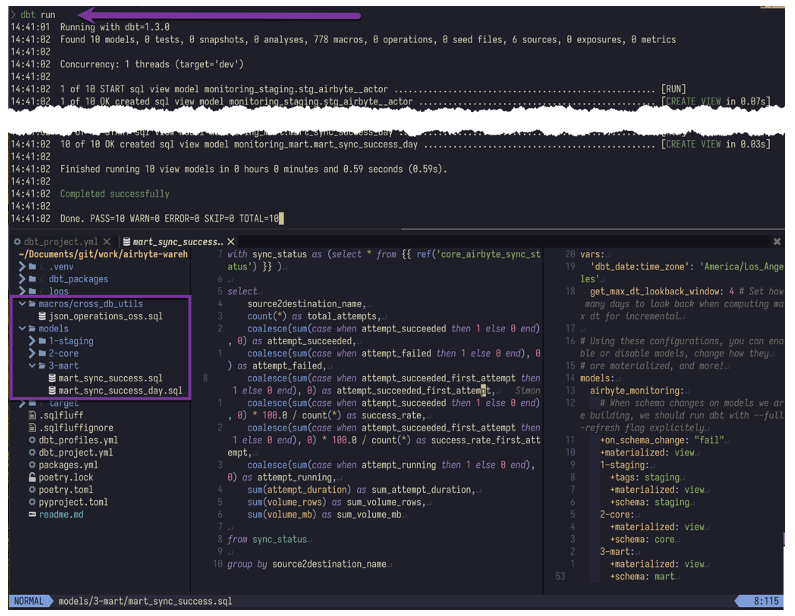
You can find the above-illustrated project with different components (e.g., macros, models, profiles…) at our open-data-stack project under transformation_dbt on GitHub.
Follow up on the dbt developer hub and play around with the open-data-stack project.
Analytics and Data Visualization (SQL)
When data is extracted and transformed, it’s time to visualize and get the value from all your hard work. Visuals are done through analytics and business intelligence and one of their tools. The BI tool might be the most crucial tool for data engineers, as it’s the visualization everyone sees – and has an opinion on!
Analytics is the systematic computational analysis of data and statistics. It is used to discover, interpret, and communicate meaningful patterns in data. It also entails applying data patterns toward effective decision-making.
If you implement strong data engineering fundamentals and data modeling, you choose the BI tool, notebook, and build your data app. It’s amazing how many BI tools get built almost daily, with Rill Data being an interesting one to look out for.
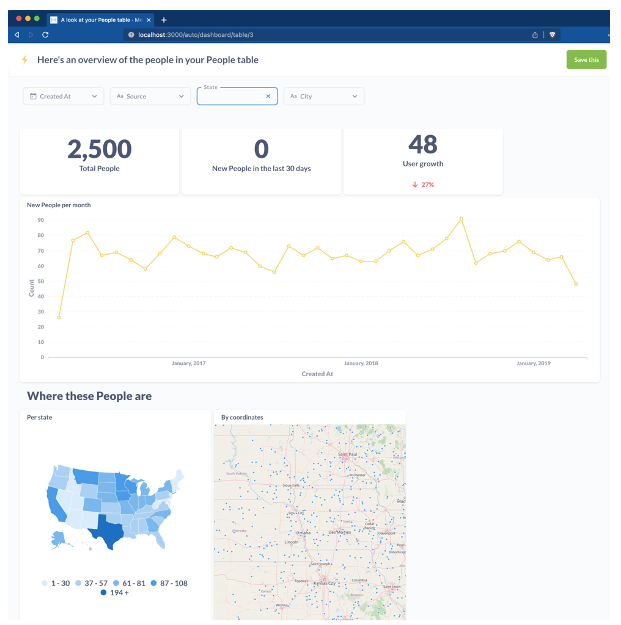
Out of the many choices available, I chose Metabase for its simplicity and ease of set-up for non-engineers.
Metabase lets you ask questions about your data and displays answers in formats that make sense, whether a bar chart or a detailed table. You can save your questions and group questions into friendly dashboards. Metabase also simplifies sharing dashboards across teams and enables self-serving to a certain extent.
How to Get Started
To start, you must download the metabase.jar here. When done, you simply run:
“`sh
java -jar metabase.jar
Now you can start connecting your data sources and creating dashboards.
Data Orchestration (Python)
The last core data stack tool is the orchestrator. It’s used quickly as a data orchestrator to model dependencies between tasks in complex heterogeneous cloud environments end-to-end. It is integrated with above-mentioned open data stack tools. They are especially effective if you have some glue code that needs to be run on a certain cadence, triggered by an event, or if you run an ML model on top of your data.
Another crucial part of the orchestration is applying functional data engineering. The functional approach brings clarity to “pure” functions and removes side effects. They can be written, tested, reasoned about, and debugged in isolation without understanding the external context or history of events surrounding their execution. As data pipelines quickly grow in complexity and data teams grow in numbers, using methodologies that provide clarity isn’t a luxury – it’s a necessity.
Dagster is a framework that forces me to write functional Python code. Like dbt, it enforces best practices such as writing declarative, abstracted, idempotent, and type-checked functions to catch errors early. Dagster also includes simple unit testing and handy features to make pipelines solid, testable, and maintainable. Read more on the latest data orchestration trends.
How to Get Started
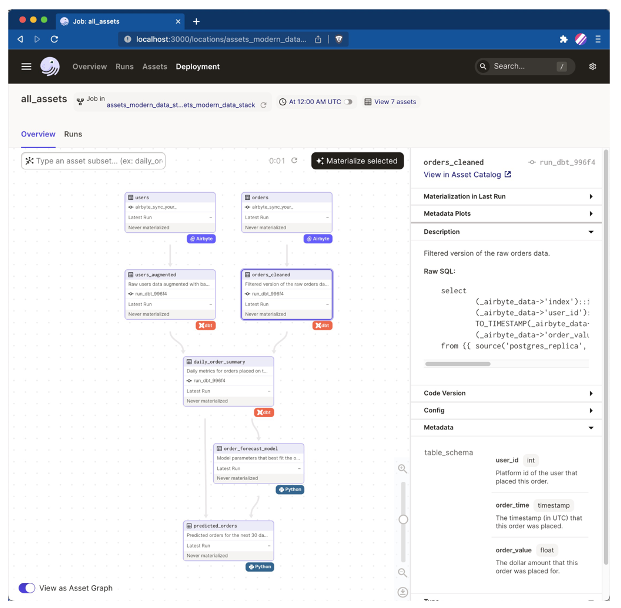
To get started easily, you can scaffold an example project `assets_modern_data_stack` which includes a data pipeline with Airbyte, dbt, and some ML code in Python.
“`sh
pip install dagster dagit && dagster project from-example –name open-data-stack-project –example assets_modern_data_stack
cd open-data-stack-project && pip install -e “.[dev]”
dagit
“`
Additional Components of the Open Data Stack
The tools I’ve mentioned so far represent what I would call the core of the open data stack if you want to work with data end to end. The beauty of the data stack is that you can now add specific use cases with other tools and frameworks. I’m adding some here for inspiration:
- Semantic Layer / Metric Layer
- Data Quality and Data Observability
- Reverse ETL
- Data Catalogs
- And many more
What’s Next?
So far, we’ve reviewed the difference between the modern data stack and the open data stack. We’ve discussed its superpower and why you’d want to use it. We also discussed core open-source tools as part of the available data stack.
As always, if you want to discuss more on the topic of open data stack, you can chat with 10,000 other data engineers or me on our Community Slack. Follow along on the open-data-stack project that is open on GitHub.