
What Are Linear Regression Models?
I am often asked about the role of intercepts in linear regression models – especially the negative intercepts. Here is my blog post on that topic in simple words with minimal statistical terms.
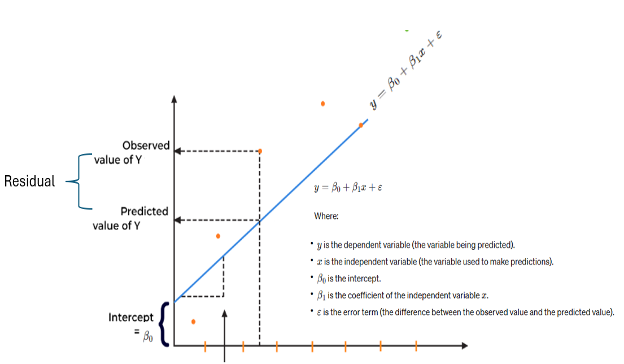
Regression models are used to make predictions. The coefficients in the equation define the relationship between each independent variable and the dependent variable. The intercept or constant in the regression model represents the mean value of the response variable when all the predictor variables in the model are equal to zero. In linear regression, the intercept is the value of the dependent variable, i.e., Y when all values are independent variables, and Xs are zero. If X sometimes equals 0, the intercept is simply the expected value of Y at that value. Mathematically and pictorially, a simple linear regression (SLR) model is shown below.
But what is the business interpretation of intercept in the regression model? In business terms, an intercept represents a baseline or starting point for the dependent variable, if the independent variables are set to zero. The intercept serves as the starting point for evaluating the effects of the independent variables on the dependent variable. It reflects the portion of the dependent variable that is not influenced by the independent variables included in the model. It helps quantify the impact of changes in the independent variables from this baseline value. For example, in a sales prediction model, the intercept might represent the expected sales when all marketing efforts, i.e., the predictors are at zero. In finance, the intercept can represent fixed or overhead costs that are incurred regardless of the level of activity or other factors.
Analytics in Action
Learn key analytics and machine learning techniques to formulate and solve business problems.

Technically, the intercept in the linear regression model can be positive, negative, or even zero.
Positive Intercept: If the intercept in the regression model is positive, it means that the predicted value of the dependent variable (Y) when the independent variable (X) is zero is positive. This implies that the regression line crosses the y-axis above the zero value.
Negative Intercept: Conversely, if the intercept in a linear regression model is negative, it means that the predicted value of Y when X is zero is negative. In this case, the regression line crosses the y-axis below the zero value.
Zero Intercept: If the intercept in a regression model is zero, it implies that the regression line passes through the origin (0,0) on the graph. This means that the predicted value of the dependent variable is zero when all independent variables are also zero. In other words, there is no additional constant term in the regression equation. This situation is extremely rate and very theoretical.
Basically, you deal with negative or positive intercepts, and when you come across the negative intercept you deal with the negative intercept the same way as you would deal with a positive intercept. But in practical terms, a negative intercept may or may not make sense depending on the context of the data being analyzed. For example, if you are analyzing the day’s temperature (X) and sales of ice cream (Y), a negative intercept would not be meaningful since it is impossible to have negative sales. However, in other domains such as financial analysis, a negative intercept could make sense.
Approaches for Negative Intercepts
Below are some approaches you can consider when you have negative intercepts:
- Check for data errors and assumptions: Before making any adjustments, ensure that the regression assumptions are met. This includes linearity, independence, homoscedasticity (pertaining to residuals), normality of the data variables and residuals, outliers, and more. If these assumptions are violated, it is necessary to address them first.
- Apply business acumen and commonsense and check if the interpretation of the negative intercept makes practical sense. A negative intercept might make sense depending on what the intercept represents. For example, in financial data, a negative intercept could indicate a starting point below zero, which may be perfectly reasonable. But if you are analyzing data on the temperature and sales of ice cream, a negative intercept would not be meaningful since it is impossible to have negative sales.
- Center the variables. Regression models are valid only for a given range of data values. But sometimes, the values of the independent and the dependent variables can be outside of the given range. In this regard, centering involves subtracting a constant value or arithmetic mean of a variable (independent) from each of its values. This can make interpretation easier, especially if the independent variables (Xs) have zero values. Basically, by centering the variables around their means, the intercept represents the predicted value of the dependent variable when the independent variables are at their mean values. Also, in some cases, extreme values or outliers in the data can lead to numerical instability in the regression models. Centering variables can mitigate these issues by reducing the scale of the variables and making the regression model more stable.
- Ensure that confounding variables are in the regression model. Adding additional explanatory variables or confounding variables to the regression model may help explain the negative intercept.
Overall, it is important to note that linear regression models are based on assumptions. Firstly, they assume a linear relationship between variables, which may not always hold true in real-world scenarios. Additionally, linear regression depends on normally distributed data and is very sensitive to outliers. Last but not least, linear regression may not perform well with nonlinear relationships, and in such cases, more complex models like polynomial regression or non-linear regression may be more appropriate.
References
- “Analytics Bets Practices” by Dr. Southekal
- “Regression Analysis” by Jim Frost
- youtube.com/watch?v=h2nkqtLjjZY
- dataversity.net/demystifying-data-analytics-models/
Level Up Your Data Skills
Build confidence in your role with 250+ hours of expert training across key data topics – all on your schedule.