Click to learn more about author Kartik Patel.
This article describes the Spearman’s Rank Correlation and how it is used for enterprise analysis.
What Is Spearman’s Rank Correlation?
Correlation is a statistical measure that indicates the extent to which two variables fluctuate together. A positive correlation indicates the extent to which those variables increase or decrease in parallel. A negative correlation indicates the extent to which one variable increases as the other decreases. The Spearman’s Rank Correlation is a measure of the correlation between two ranked (ordered) variables. This method measures the strength and direction of the association between two sets of data when ranked by each of their quantities.
Let’s compute the Spearman’s Rank Correlation coefficient between two ranked variables X and Y that will illustrate a positive correlation:
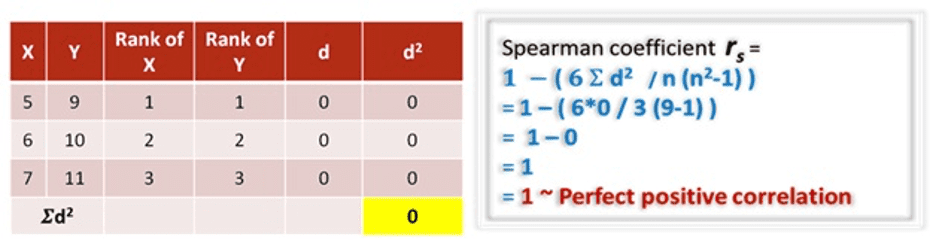
The closer the value is to ±1, the stronger the relationship between variables. The closer this value is to 0, the weaker the relationship/association is between both variables.
How Is Spearman’s Rank Correlation Useful for Business Analysis?
Let’s look at two use cases to see the application and benefit of the Spearman’s Rank Correlation.
Use Case 1
Business Problem: An educational organization wants to assess student rating based on two different sources of observation.
Input Data: Students’ ratings by department chairs and students’ ratings by the faculty members.
Business Benefit: This analysis will help the organization to assess the consistency of the ratings provided by the two sources of student ranking and observation. If the ranking given by both observers is similar, the organization can put more faith in the ratings than if the observer ranking varies widely from one to the other. This will also reduce the chance of biased or unethical ranking systems.
Use Case 2
Business Problem: A market research agency wants to cluster various survey responders into groups based on the rank correlation output.
Input Data: Responses on brand loyalty containing values on a scale of 1 to 5, with 1 representing disloyal, 2 meaning somewhat disloyal, and so on, and respondent frequency of brand visits per month (here responders with visits above 10 per quarter can be ranked as “1,” between 8 to 10 as “2,” and so on).
Business Benefit: If the values of brand visits and brand loyalty turn out to be positively correlated, then the organization can cluster the ongoing frequently visiting customers into a “brand loyal” segment and rarely visiting customers into a “brand disloyal” segment. Upon identification of these disloyal customers, the organization can focus on converting “disloyal” visitors to “loyal” visitors.
The Spearman’s Rank Correlation is a measure of the correlation between two ranked (ordered) variables. This method measures the strength and direction of the association between two sets of data, when ranked by each of their quantities, and is useful in identifying relationships and the sensitivity of measured results to influencing factors.