The Enterprise Data World 2017 Conference in Atlanta in the beginning of April was one of the best I have attended in recent years. At least 50 sessions for a guy like me interested in modeling. I chose to focus on sessions possibly related to Data Modeling in the new worlds of NoSQL, Big Data and Data Lakes. And that was enlightening. Here are some phrases used on the fly and in no particular order:
Replacement for relational, schema last, MDM using graphs, data curation, metadata in RDF triple stores, NoSQL data modeling ROI as in conventional, embedding is a relationship, data is people, data management reality = hard, turning the practice of data management into a science, data lakes, data quality ratings, ontology driven, glossary, business vocabulary, machine-self-learning, relationship discovery, data catalog, information catalog, automodel (by way of crawling), collaboration (crowd sourcing), catalogs are graphs, machine learning the meaning of data, automated discovery, taxonomies, automated tagging, smart domains, AI data management software.
Buzzwords? Yes. Reality? Also yes, but filter out the marketing as you read.
From Top-Down to Bottom-Up
What is happening is that we are shifting the paradigm for Data Modeling. People like me grew up with requirements leading to conceptual models leading to logical models leading to physical models.
In a recent blog post (Artificial Intelligence vs. Human Intelligence: Hey Robo Data Modeler!), I looked at the paradigm shift from top-down data analysis and design towards bottom-up data analysis and design. Discovery of data models, if you will. AI technology assisted by humans. I illustrated why humans are still necessary and some of the issues lie well within the business terminology understanding, which is hard to automodel.
This new paradigm can said to be “Schema Last”. But quite a few speakers argued that for keeping business continuity a minimum schema derived top-down from the business level is the way to go to. I concur.
There is considerable terminology disorder in these matters. I particularly like the terms used by Data Management veteran Mike Ferguson:
- Crawl the data lake to
- Discover
- Tag and
- Inventory Data.
(The software doing the crawling is the information catalog etc., of course).
Discovery
Discovery can happen both on the meta level and the data level. Trying to match names is part of it. Trying to figure out what the data represent using data profiling is another important activity. This is not something new, really. There have always been a lot of bottom-up design going on, incl. data profiling for data analysis. However, what is new is the automation, heavy-weight Machine Learning and collaborative crowd sourcing style modeling on the business / logical levels.
Tagging
Tagging and so forth involves collaboration (humans) overriding autogenerated tags in processes involving voting and reviews. And a lot of Data Governance based on glossaries and ontologies.
Automated analysis of structure and meaning is a dominant trend that is going to impact Data Modeling in the coming years.
Graph and Other NoSQL Technology
Technology, of course, is also changing a lot. A lot of emphasis on graph data models and graph technology – both property graph and RDF/triple store technologies have a lot of attention, and are used widely behind the scenes in catalogs and other metadata systems such as MDM.
Some ventured to suggest that what is going to replace relational eventually, is the combined benefits of graphs and documents:
- Graphs for structure and meaning
- “Documents” (hierarchical or combined aggregates and repeating groups) for flexible, “schema less“ flexible content.
This is good news for multi-model DBMS vendors like Marklogic and OrientDB, obviously. If you ask me, it makes a lot of sense. As April Reeve put it: “Traditional approaches are not getting data to people fast enough. In consequence we need to automate as much as possible.” And be flexible as much as possible. (The last statement is my own, the preceding two are from April).
Does This Make Sense?
Shifting to graphs for structure and meaning is indeed a sound, next step. Here is why.
The process starts with getting at some data in the lake and examine them.
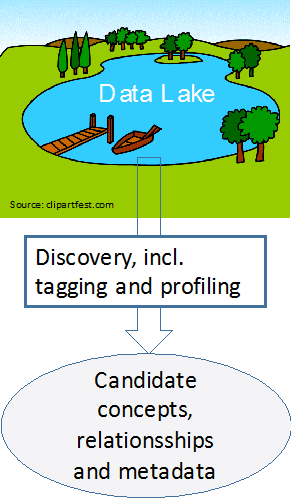
This is the Discovery process from above. What we get (from the automated AI-based process) is a bunch of information meta objects, which we must:
- Fit into the business level terminology of the organization, as well as
- Use to describe the data we discovered in the lake, and (on the more trivial side)
- Catalog the metadata for future use, including data types etc..
Besides the catalog we need to visualize two levels of representations for non-physical models:
- The business level, where tagged structures meet business vocabularies and “ontologies” there is a need for concept level structures concerned with objects, properties and relationships
- The solution level, the model of the data in the lake (previously known as the logical data model). This is where the data are described by possibly aggregated versions of the concept models enhanced with actual physical data types etc.
This leaves us with this picture:
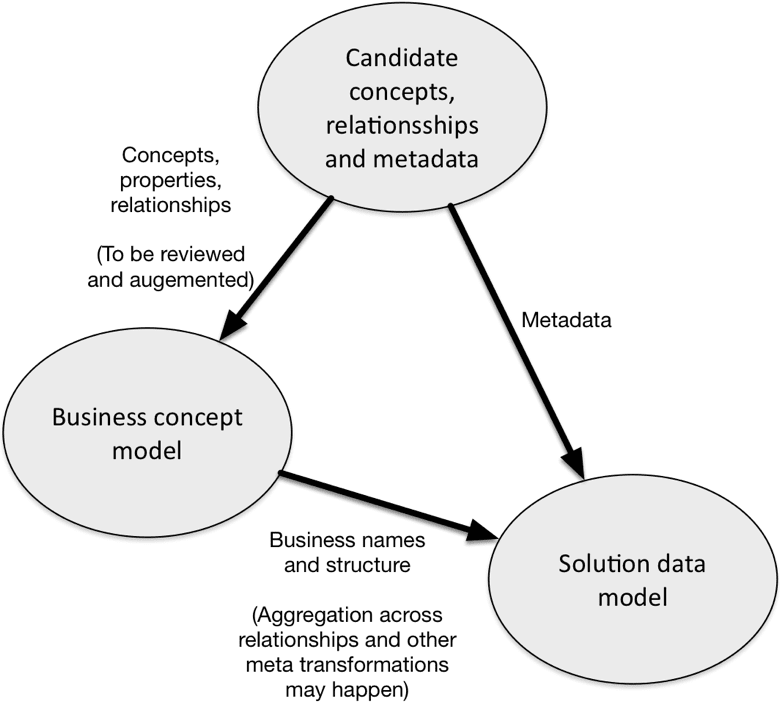
The left hand side is accumulating the business level model over time. It is here we find tools such as business glossaries and vocabularies, ontologies and so forth. There is a noticeable need for human intervention here. Most of it can be dealt with by business people taking care of terminology etc. in collaboration supported by the catalog, but some issues definitely need Data Modeling skills as well.
It is given that the results of the discovery processes are on the level of atomic concepts (entity or property types, if you insist) and relationships. This means that the target business level model could be either concept models (e.g. like in the OMG standards and in concept maps) or RDF (triple store) based. Both approaches are based on directed graphs. My recommendation is business concept models, because concept models are simpler and more business friendly than the RDF-based ontology approaches, but they are, in fact very close to each other when it comes to mundane challenges.
The right hand side works more like a traditional repository describing a logical data model. Business names should be carried over from the business concept model and technical meta data should be merged in place.
The same business concepts can be reused in several solution data models, possibly with slightly different designs. This means that as part of building the solution data model, denormalized structures (and other transformations) may occur – also guided by somebody with modeling skills. Since the solution types can be quite variable there is a need for a “universal” data model paradigm powerful enough to adapt to documents, key/value stores, graphs and, yes, table stores in SQL. My recommendation is property graphs, because they are easy to derive from concept models, and they also communicate well to business people for most mundane business problems, property graph models work just fine.
Some physical model level tools are emerging, such as Hackolade. They will need to interoperate with the information catalogs – or become part of them.
In conclusion
Bottom-Up modeling in semi-automated fashions is going to be an everyday activity. Top-Down is still around, not least because data model discovery must integrate at the business level. From there the solution data models trickle down with some help from a data modeler.
Oh, and one more thing: The catalog providers should rush to graph visualizations as soon as they can, and before their competitors do so!