Click to learn more about author Steve Miller.
I did a short consulting gig last year with a company that was building an analytic app driven largely from a web-based data repository. The data were stored as a collection of SAS data sets which “customers” would subset by uploading SAS data step and proc SQL scripts. The resulting data were later made available for download. My role was to mentor the team on the use of SAS for their data management and analytics challenges.
My first assignment was helping the team settle on a SAS development environment. A thrifty startup, the customer suffered severe heartburn with SAS pricing and asked for a plan B recommendation. As luck would have it, I’d done some work with World Programming System (WPS), “a powerful and versatile platform for working with data. WPS software can run programs written in the SAS language……The supported syntax covers core, statistical and graphing functionality, and makes it possible to run many applications written in the SAS language whilst the breadth of language support in WPS continues to grow.” Critical for this project, WPS supports all the programming structures of Base SAS — the data step, data management procs, proc SQL, the macro language, along with a nifty IDE/GUI workbench — at a fraction of comparable SAS licensing costs. Assured that their SAS data programming needs could be met, my customer settled on WPS.
After installing and configuring WPS, I was tasked with developing a solution to a performance challenge we faced early on. The SAS data sets we downloaded were both long and wide, typically with millions of records and hundreds of columns. Most of the columns, though, were empty/null or almost so. We wanted to implement a procedure that would inspect the SAS data sets and identify all totally or primarily null columns, returning skinnier data sets with the empty/sparse columns eliminated, thus decreasing storage needs and enhancing script performance. It turns out that’s not so easy to do using Base SAS programming.
I was a SAS head in the 80’s and 90’s, often using the platform for data warehouse ETL work. I became pretty facile combining the data step and proc SQL to handle data management challenges, though I must admit never being enamored with the macro language for building reusable code. So when I started to think about building such a procedure in SAS, I realized just how daunting the work would be. Indeed, I came across a very well-done presentation that affirmed my concerns.
An alternative design for this challenge involved WPS’s proc R, wherein the capabilities to export/import SAS data sets to R data frames as well as execute R code from SAS/WPS scripts could be utilized. Once I was in the R world, the task of identifying sparse columns and creating a new data frame with those columns removed was simple. So the sequence involved 1) exporting the SAS data set to an R data frame; 2) producing a new R data data frame with the offending columns eliminated; and 3) importing that new data frame to a SAS data set. It turns that in addition to proc R, WPS now supports a proc Python where same steps can be implemented using Python and its libraries.
The remainder of this blog showcases code first in proc R, then in proc Python for producing “skinnied down” SAS data sets. It should be noted that SAS also offers a proc R that would handle this challenge. Alas when last I checked, SAS’s version was an extra cost addon.
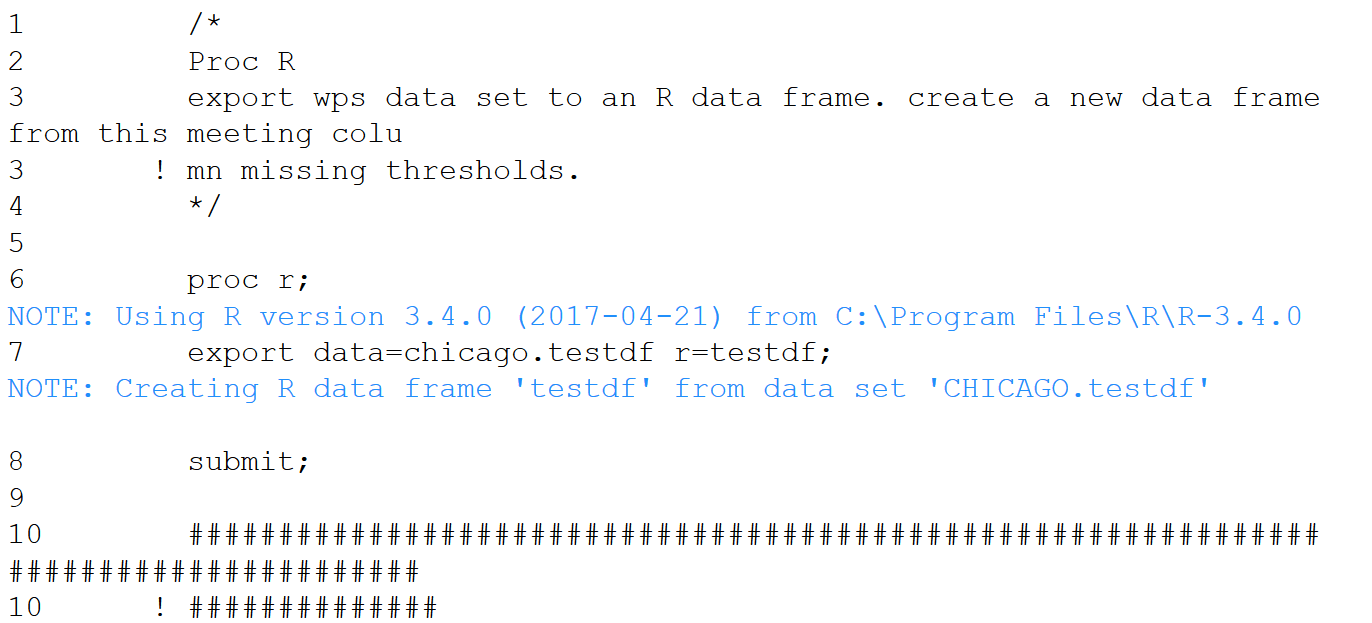
What follows is Jupyter Notebook with a WPS 3.3 kernel to demonstrate proc R and proc Python proof of concept solutions to the challenge. The test SAS data set used has 1,642,901 rows and 264 columns. For this example, we choose a 60% threshold of not null data for column inclusion. Both the R and Python functional code is much simpler than a potential SAS solution.
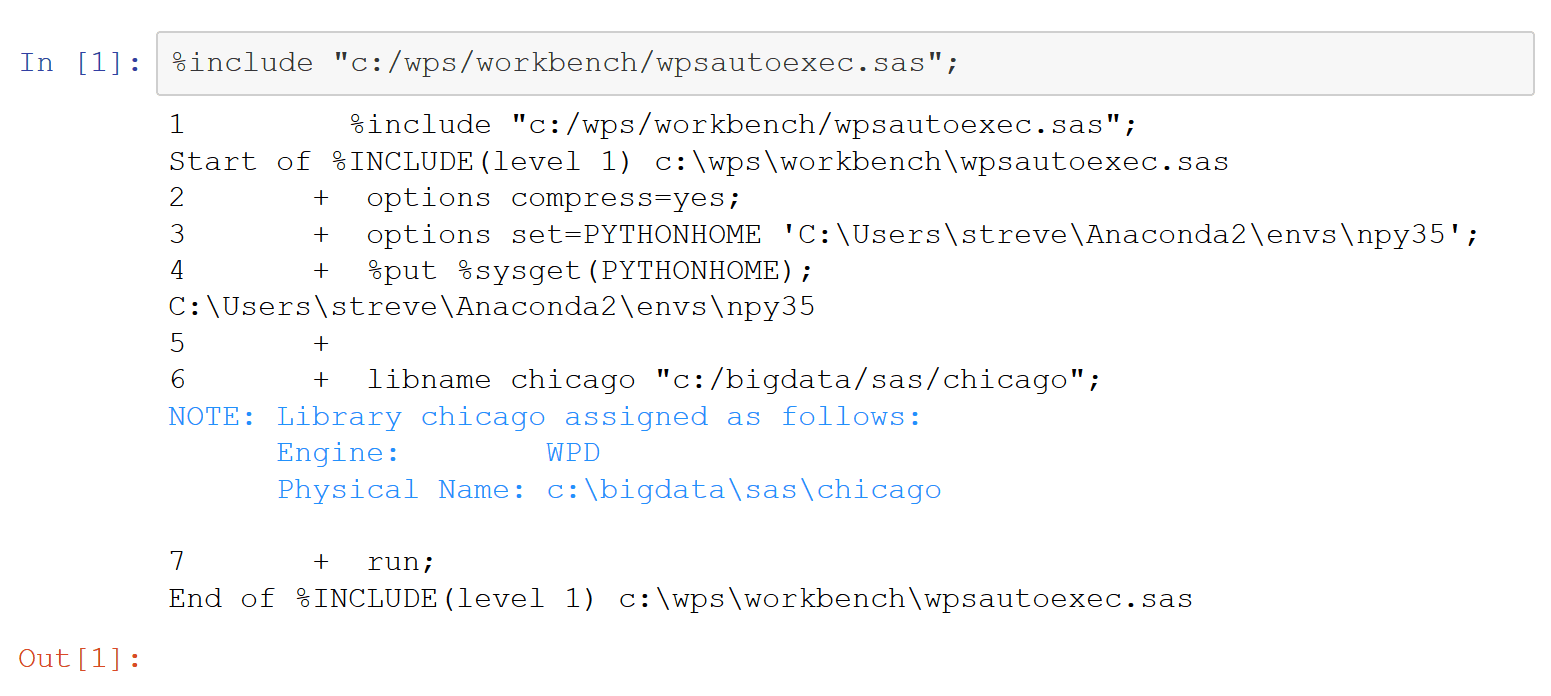
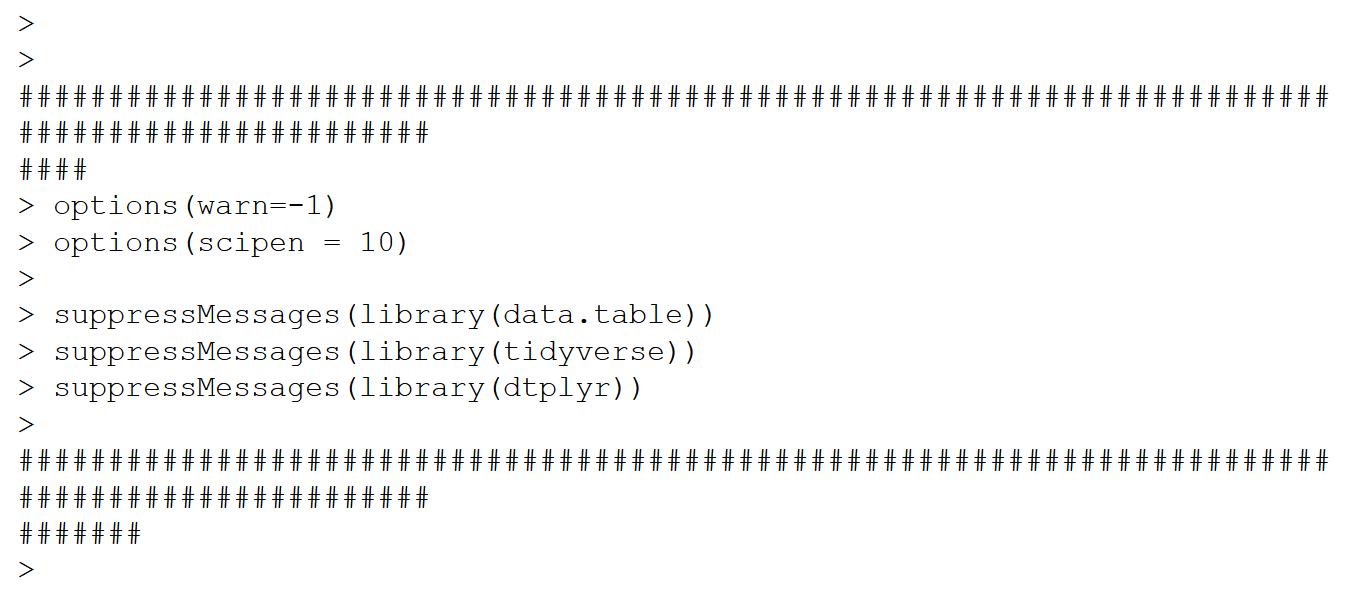
First include/run a SAS autoexec file.
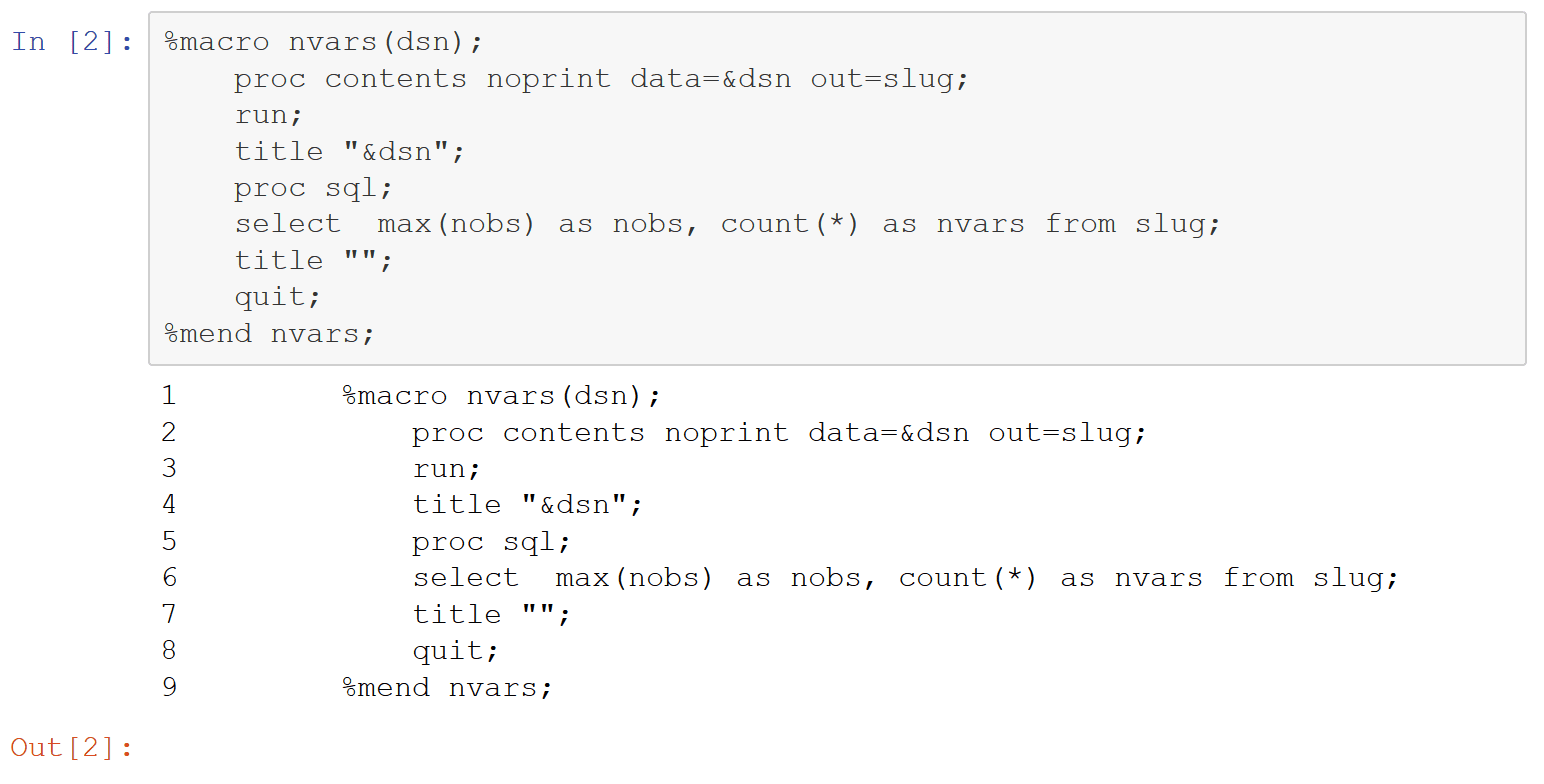
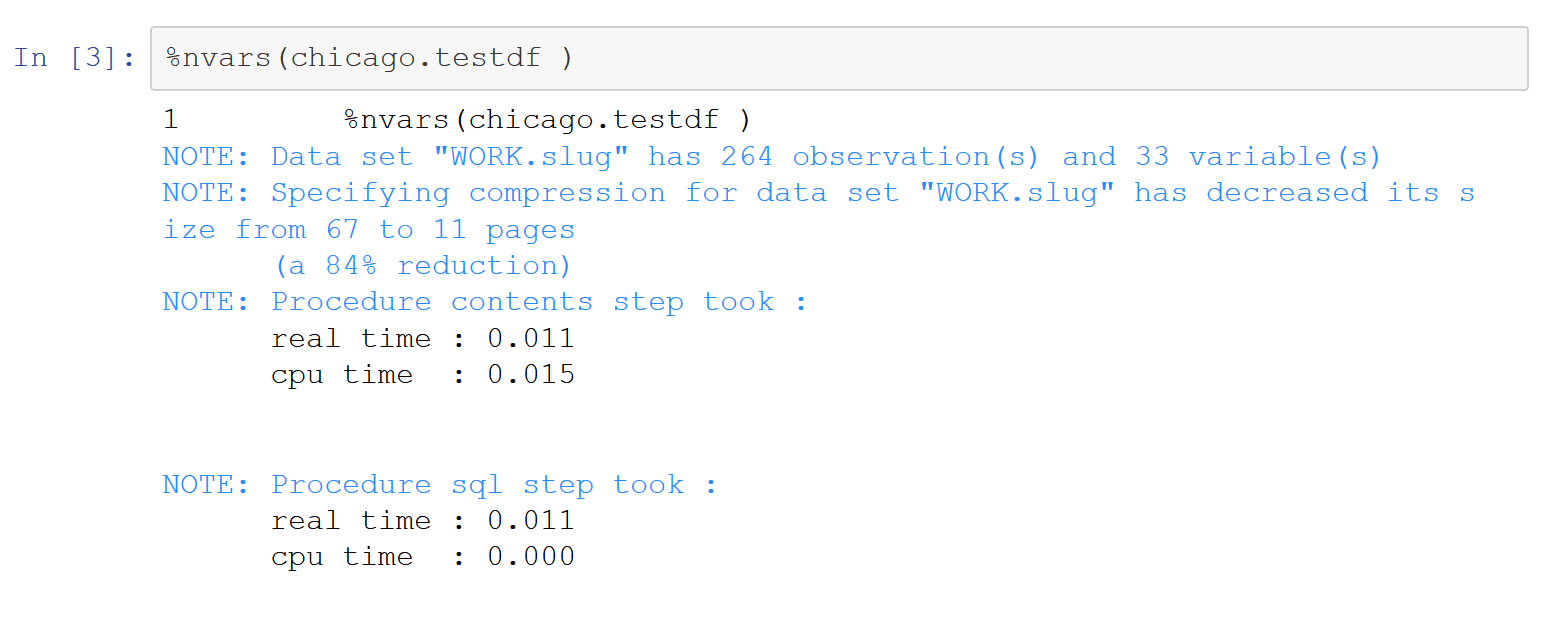
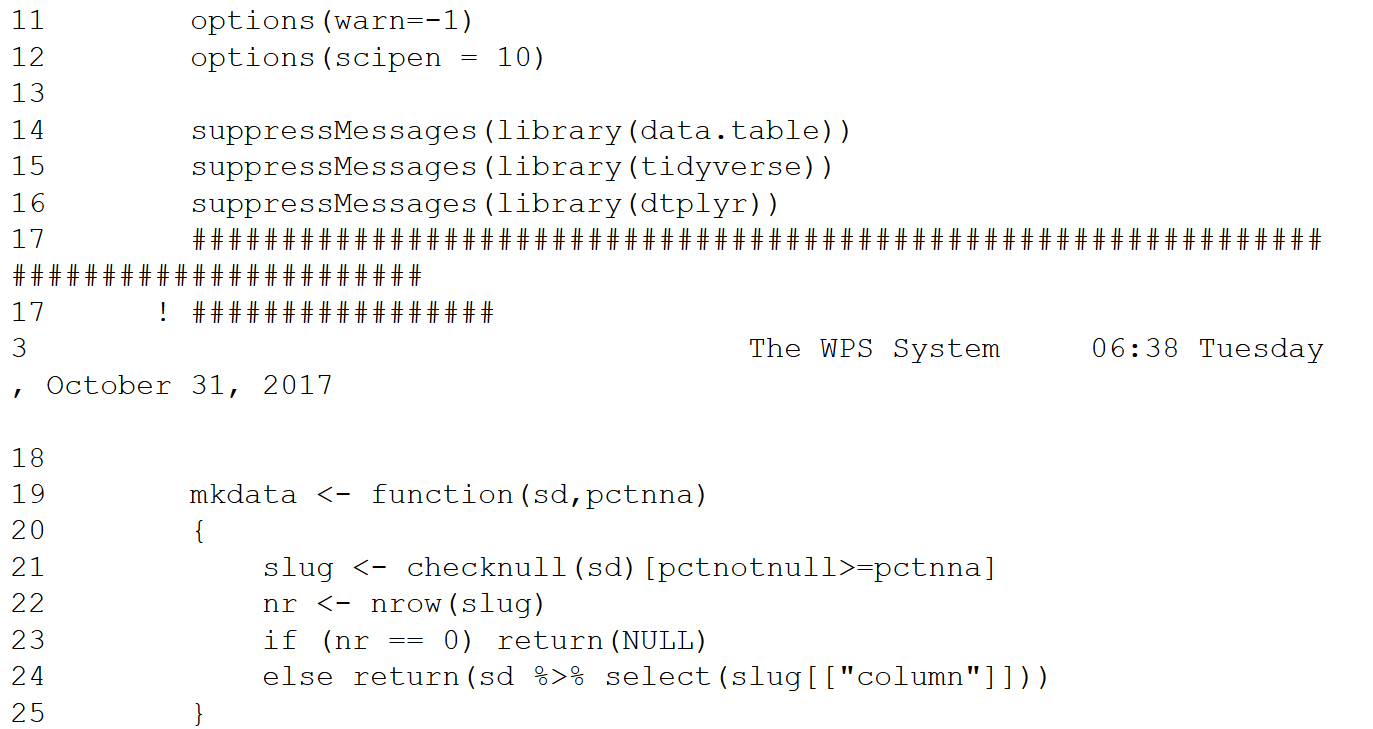
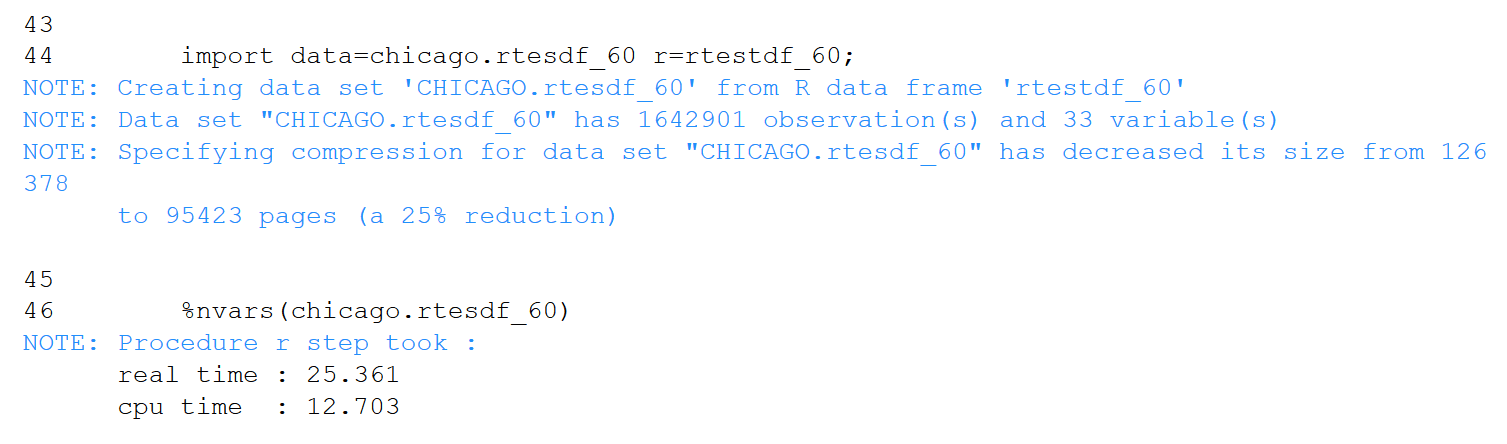
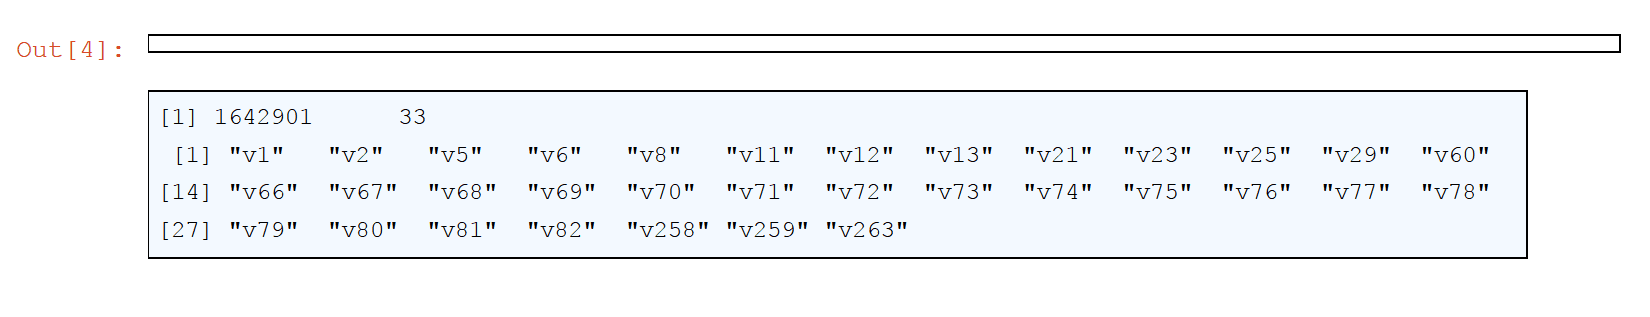
Next define a simple SAS macro “function” that takes a data set name as an argument and prints the # of rows and columns. Invoke it on the test SAS data set.

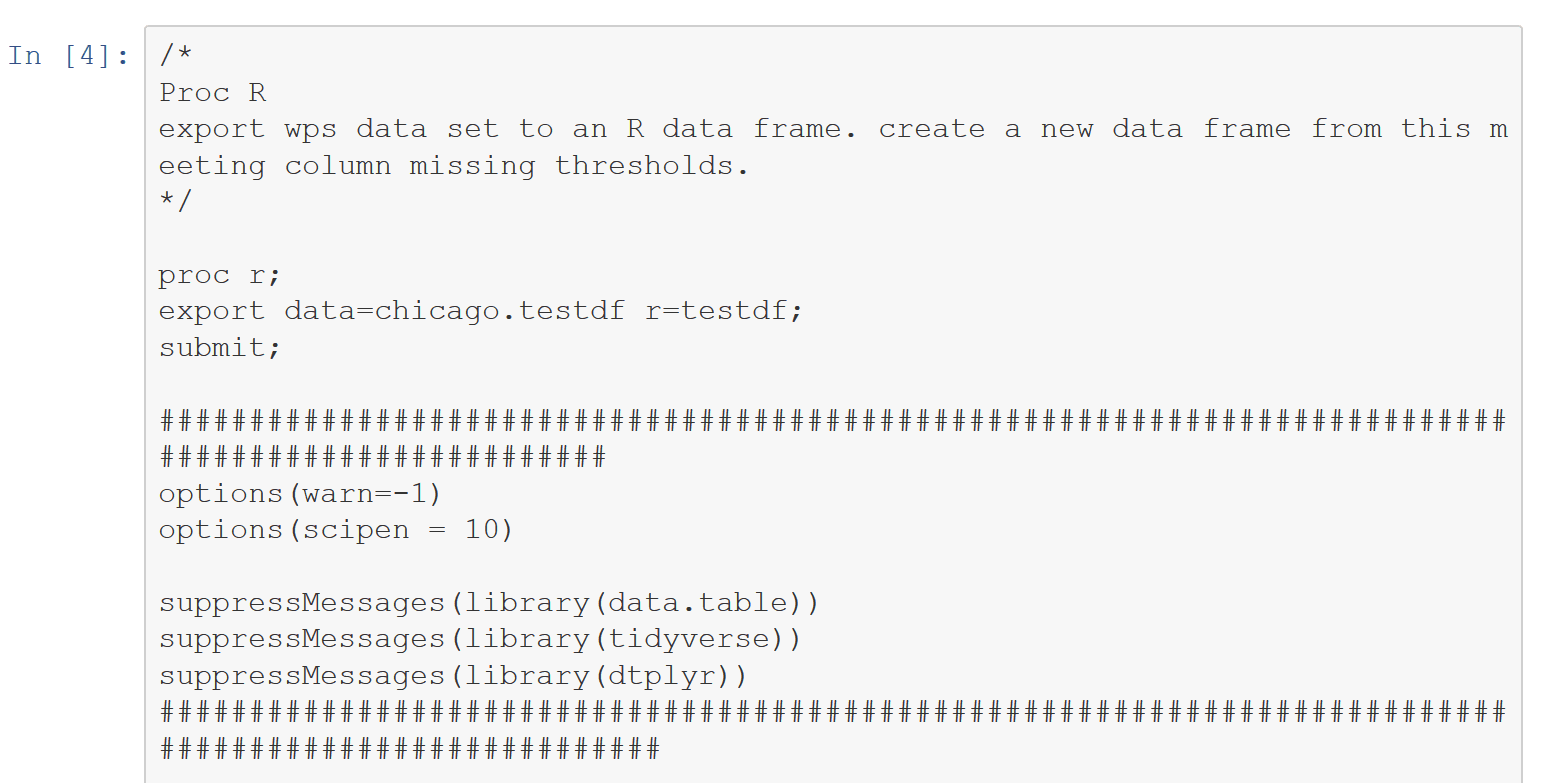
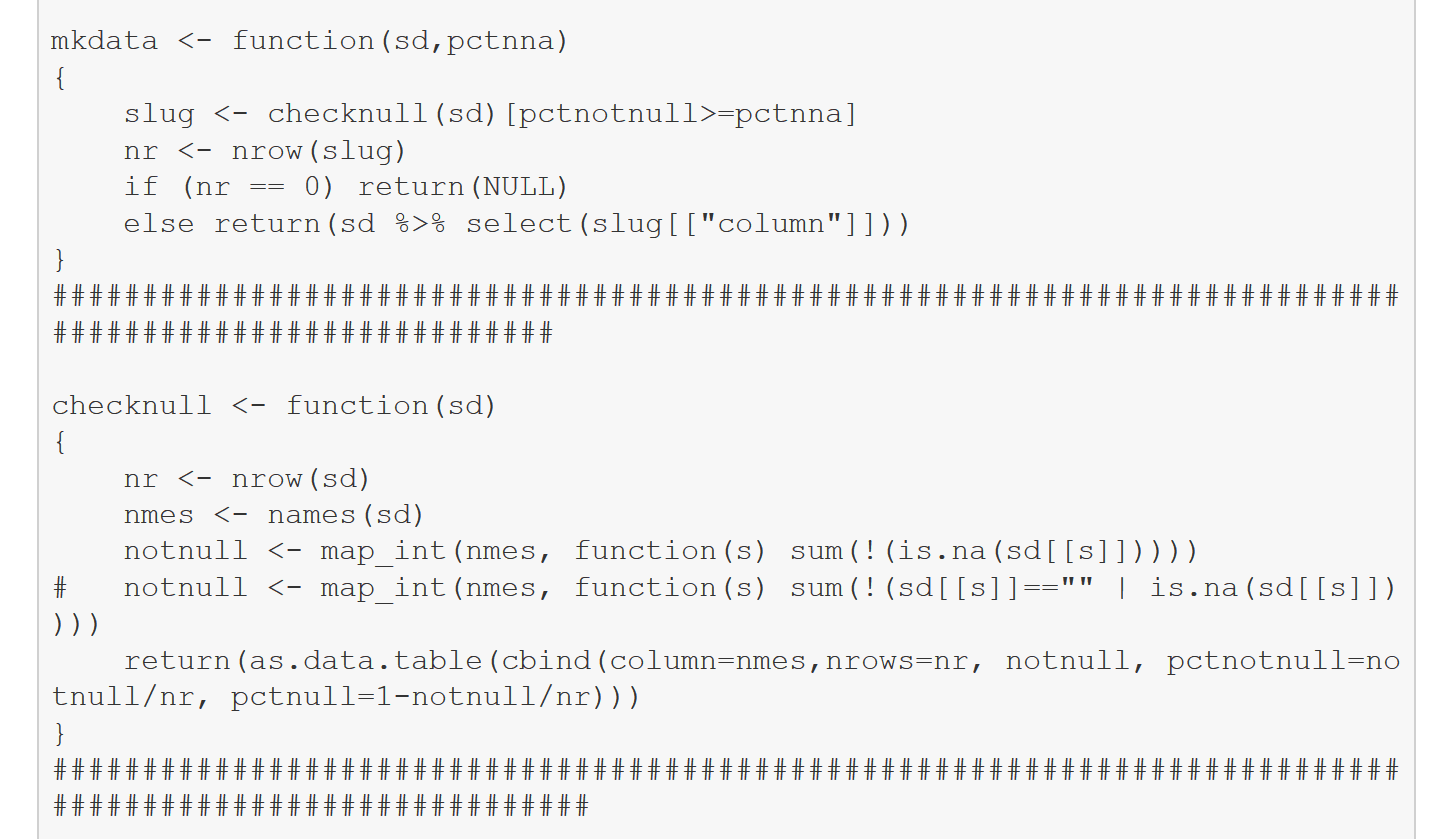
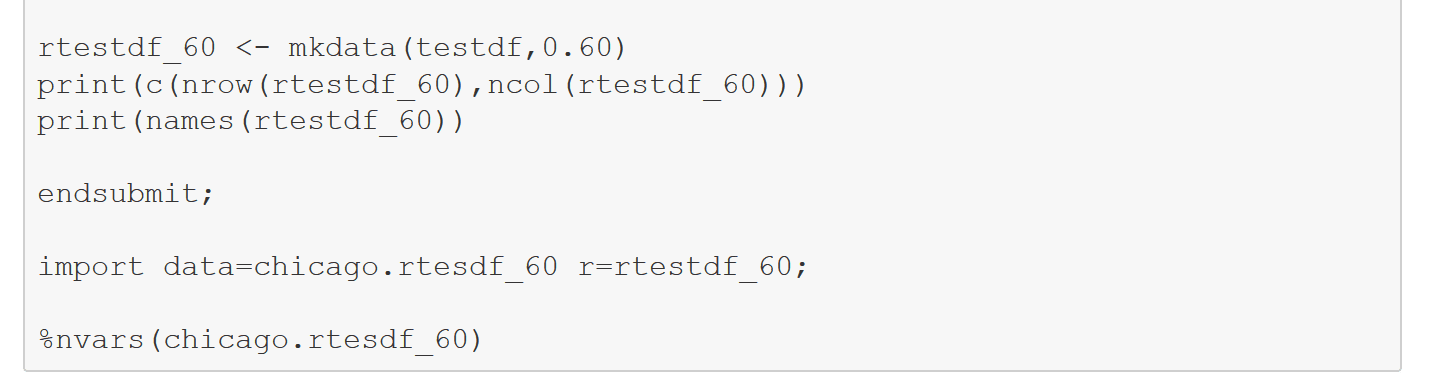
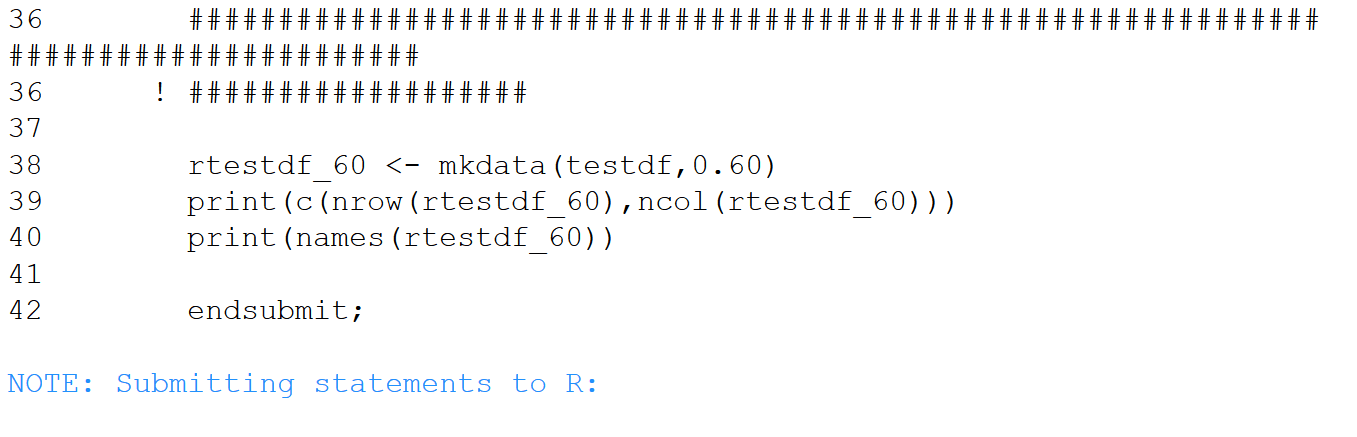
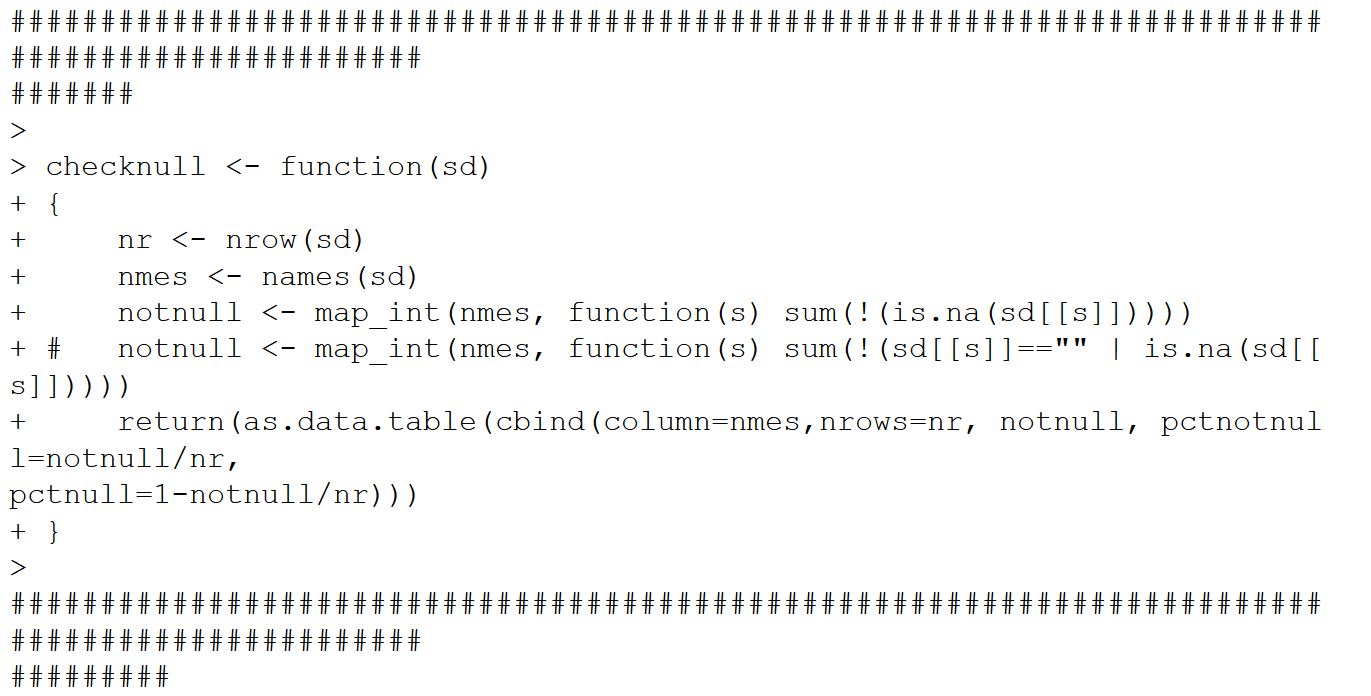
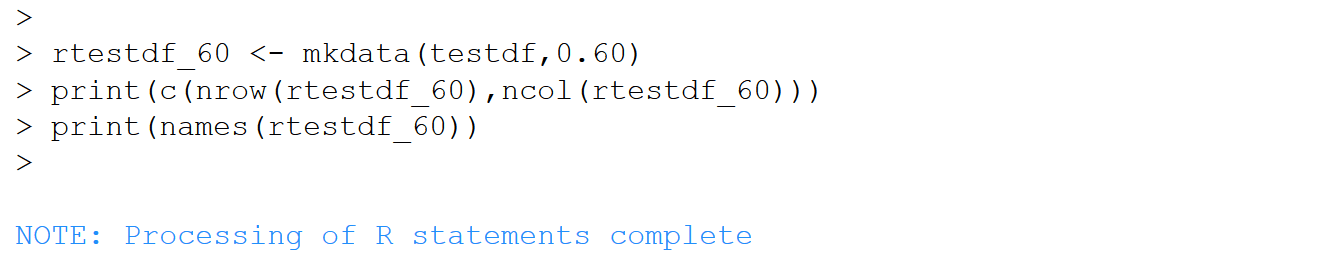
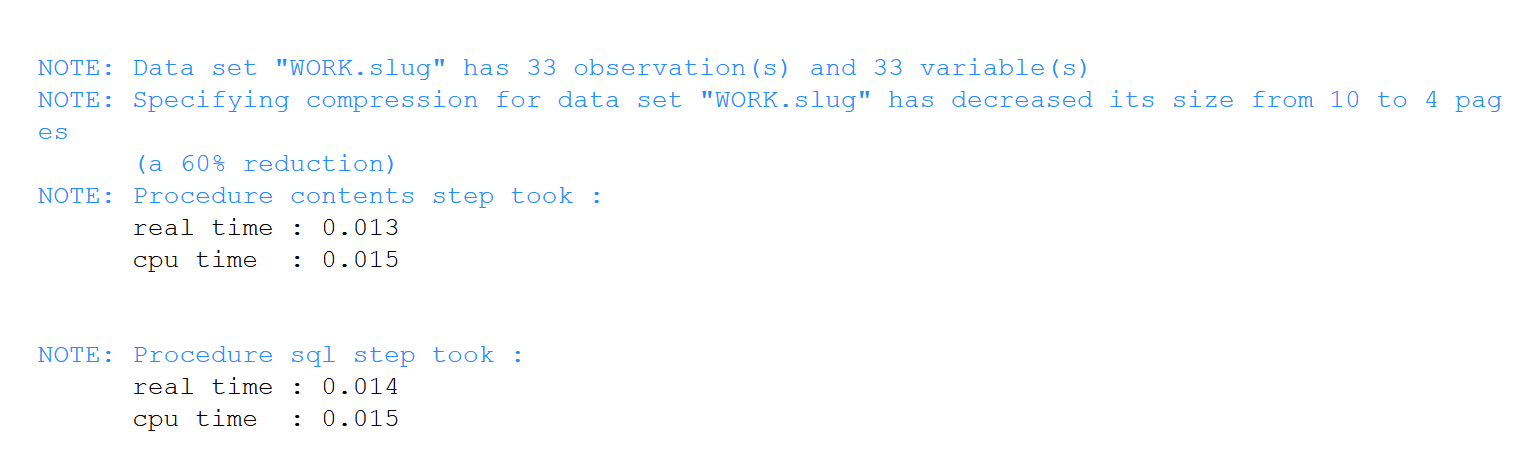
Export the test SAS data set to an R dataframe, determine which columns are 60% or higher notnull, assemble those columns into a new dataframe, then import that dataframe to SAS. Note the commented out statement identifying blanks in addition to nulls. Only 33 of the 264 columns meet the 60% threshold. The execution of this cell was quite speedy.


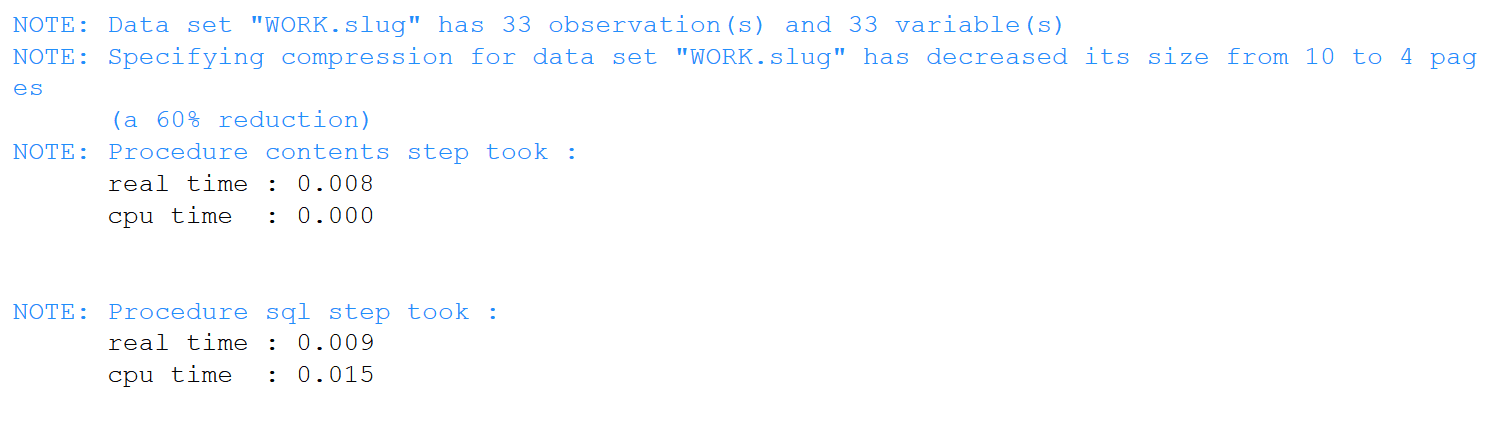

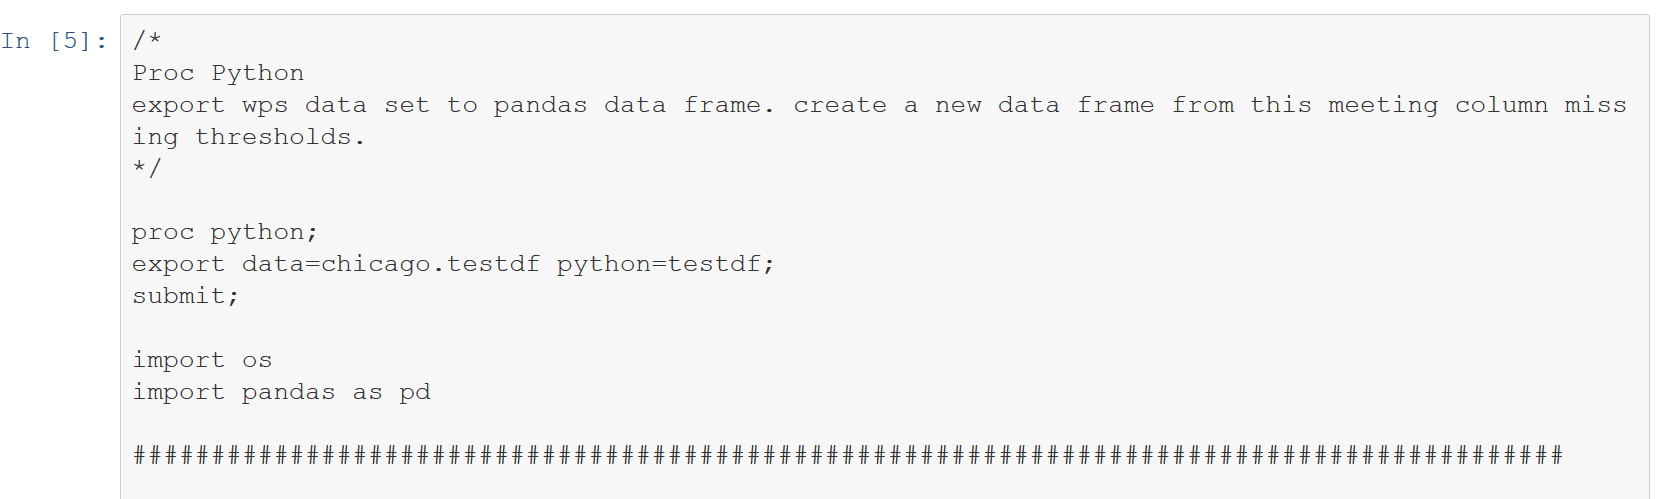
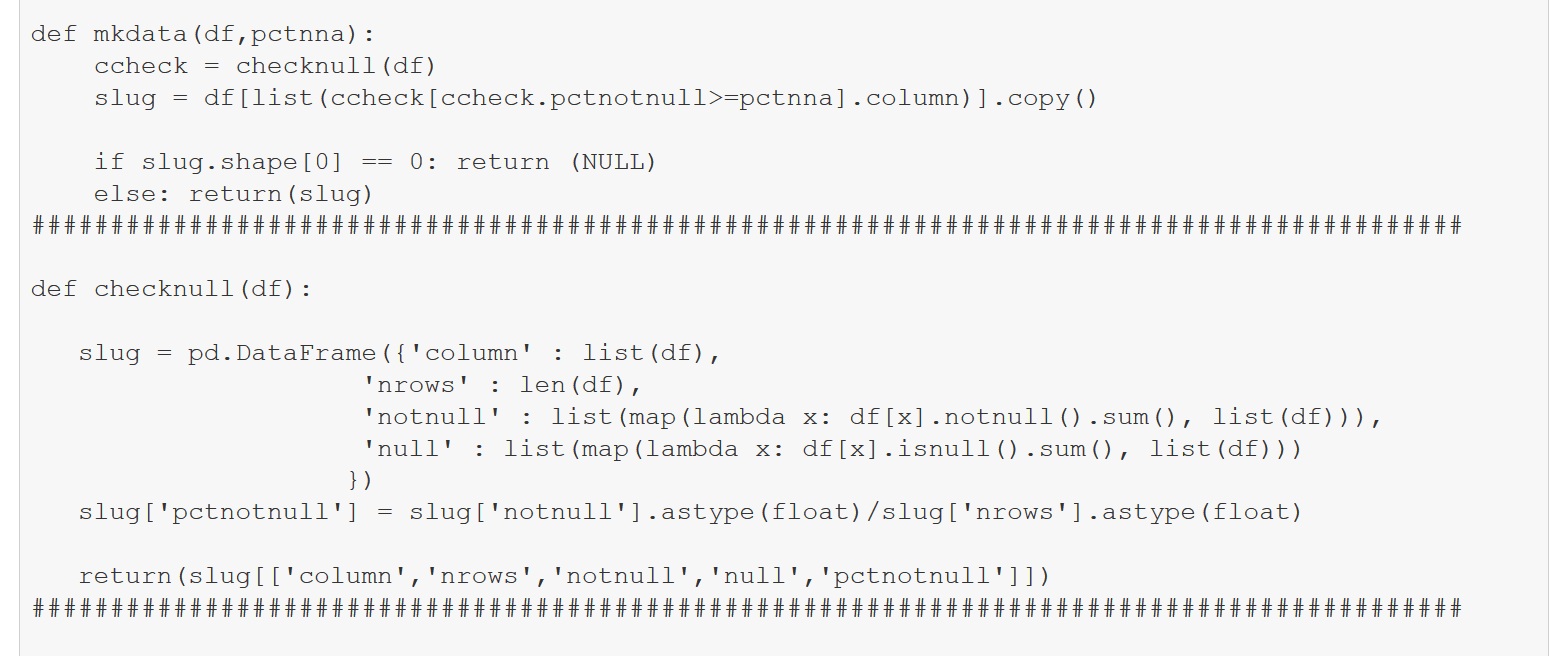
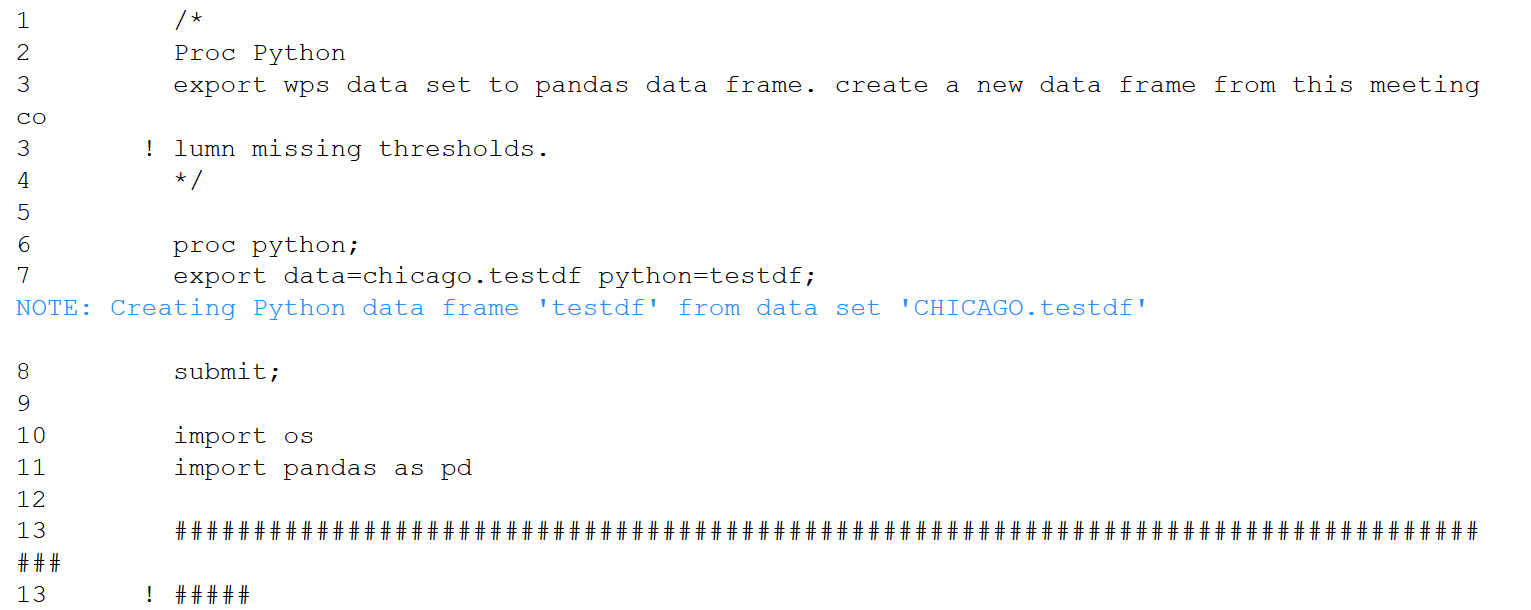
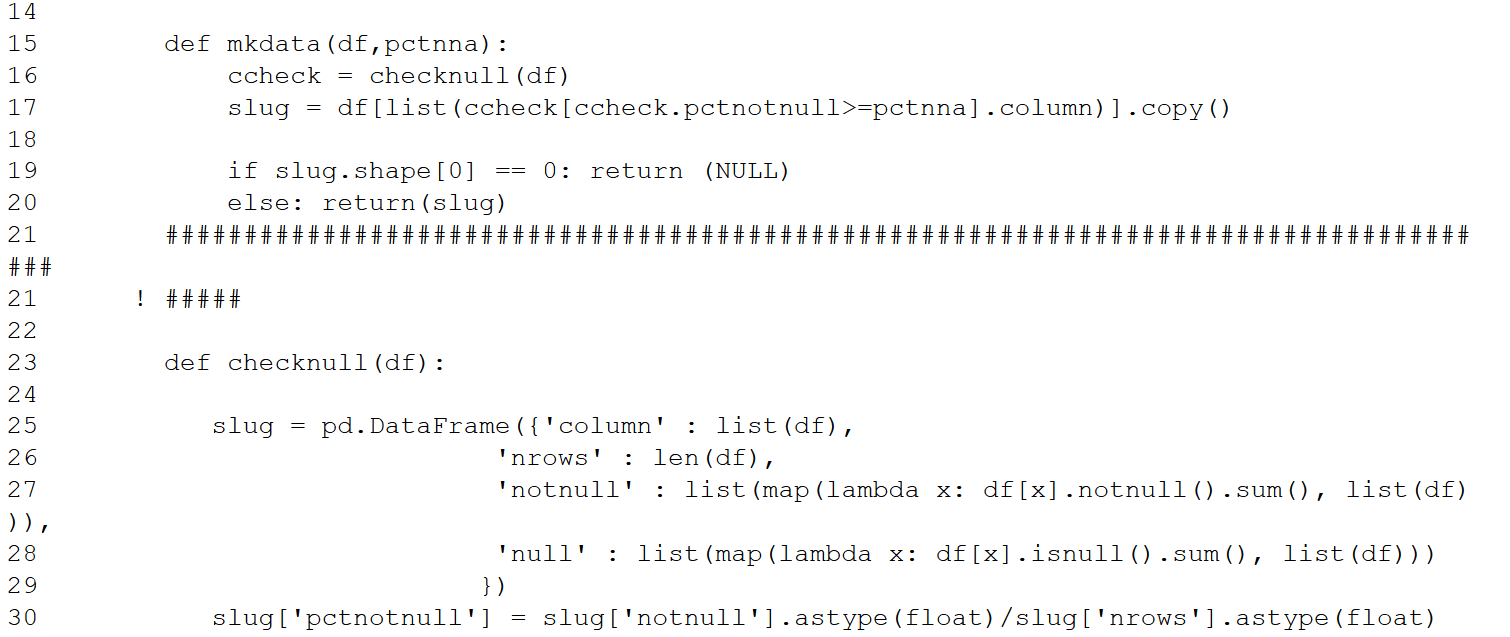
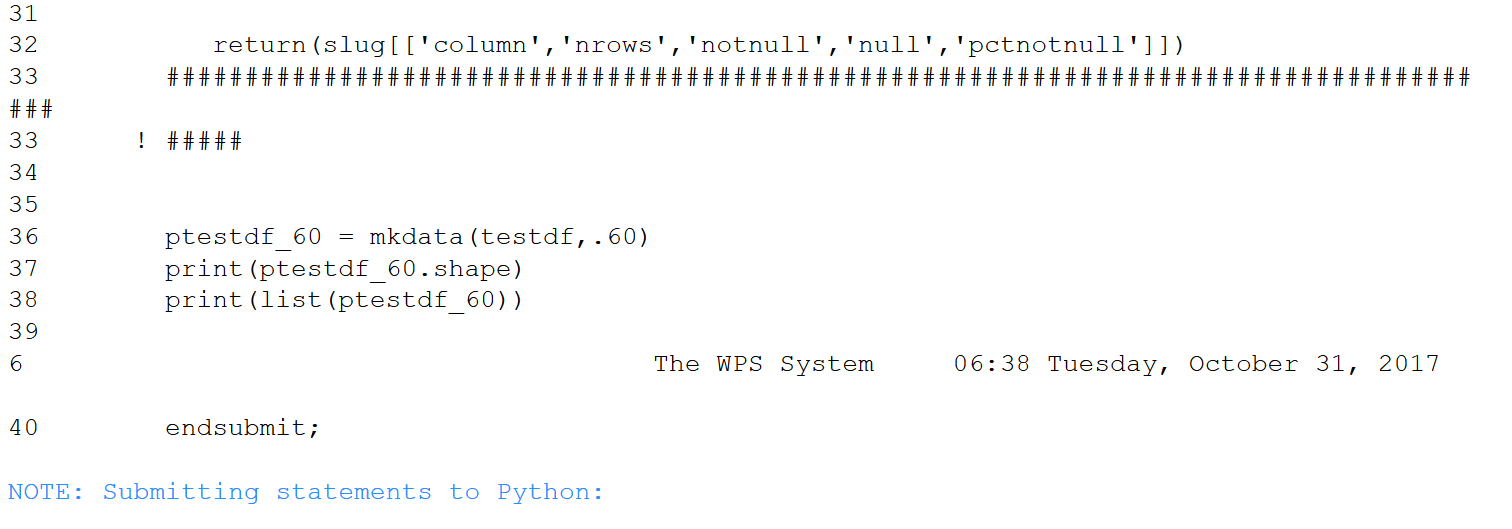
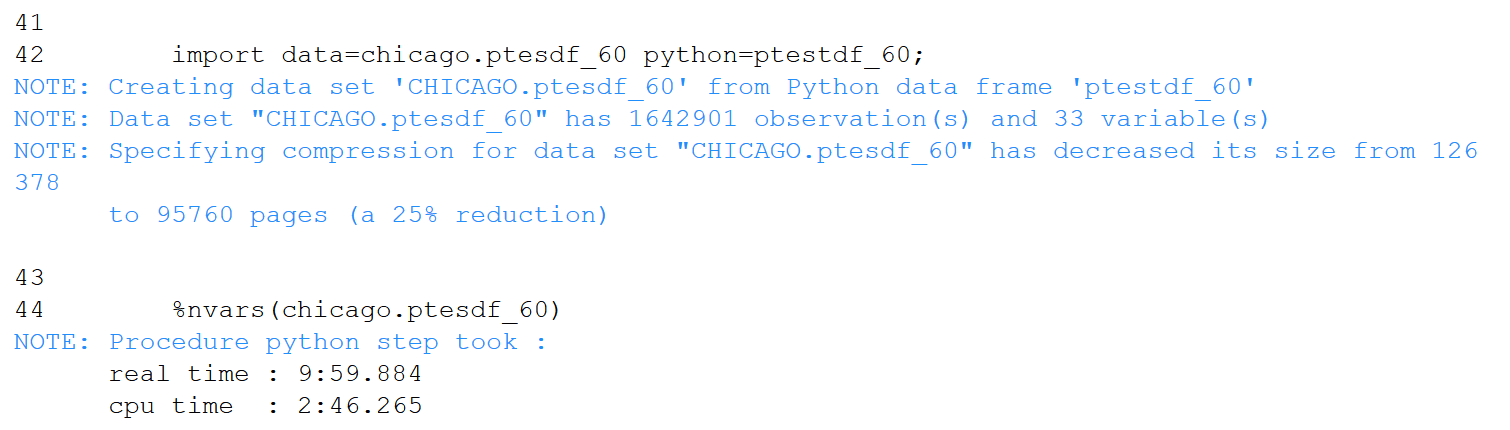
Next, export the SAS data set to Python pandas, then deploy Python functions to determine the %notnull in each column and create a new pandas dataframe with only columns having %notnull in excess of .6. After Python processing, import the pandas dataframe into SAS. As with R, only 33 of the 264 columns survive. This cell consumed over an order of magnitude more time than the previous one.


Though SAS is still a major analytics platform that’s not going away anytime soon, it is ceding ground to R and Python for analytics work. For SAS/WPS programmers, procs Python and R can be very useful adjuncts to Base SAS. Indeed, interoperability among competing data science ecosystems, both commercial and open source, will continue to increase — and this is nothing but good for the data science world. Right now, WPS’s proc R is quite a bit faster than proc Python, so would be the choice for collaborative SAS work. The hope is that proc Python will soon be as performant, affording SAS data programmers equal access to the top two DS platforms.