Click to learn more about Steve Miller.
Scraping data from the web is a task that’s essential to the data scientist’s hacking portfolio. The complexity of work ranges from sophisticated crawling that mandates understanding the structure of dynamic web pages along with command of css and/or xpath, to the more mundane “just grabbing a table of static data”. I’m into both, loving libraries like beautifulsoup for serious python crawling, but at the same time demanding simple tools for quick and dirty work.
I’ve found what I believe are pretty nice solutions for scraping tabular data in both python and R using community-developed libraries and a work-saving app called SelectorGadget, “an open source tool that makes CSS selector generation and discovery on complicated sites a breeze.” Once SelectorGadget is installed, the user invokes it on the desired web page, where it generates css text from clicks on chosen page elements. The generated css, along with page urls, are then input to functions in either python or R that return content to programming structures. In python my current scraping package choice is lxml, while in R, it’s rvest by Hadley Wickham.
The short script below illustrates basic tabular web-scraping in python/lxml. The task here is to capture global rankings of universities published by U.S. News. The site lists 183 American universities, of which 181 are assigned rankings, over 19 pages. Attributes include school name, location, score, and world rank.
SelectorGadget makes the task of generating the css in this instance trivial. After invocation, a few clicks on the table elements identifies “#resultsMain :nth-child(1)” as a reasonable css starting point.
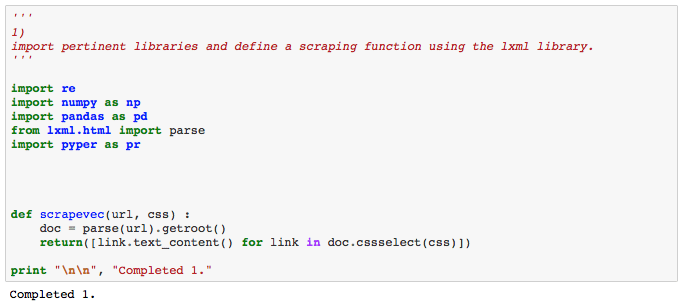
The python code and results of the scraping are presented from a snapshot of the Jupyter notebook used in tandem with Rodeo for development. In 1), the relevant python libraries are imported and a simple function packaging the lxml library defined. scrapevec takes a url and css as arguments and returns a list of text each time it’s invoked. In this script, scrapevec is called 19 times – once for each url but the same css.
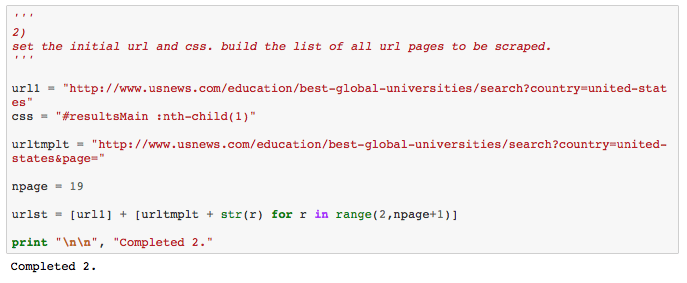
2) sets the css and creates a tuple of urls to be traversed using a list comprehension.
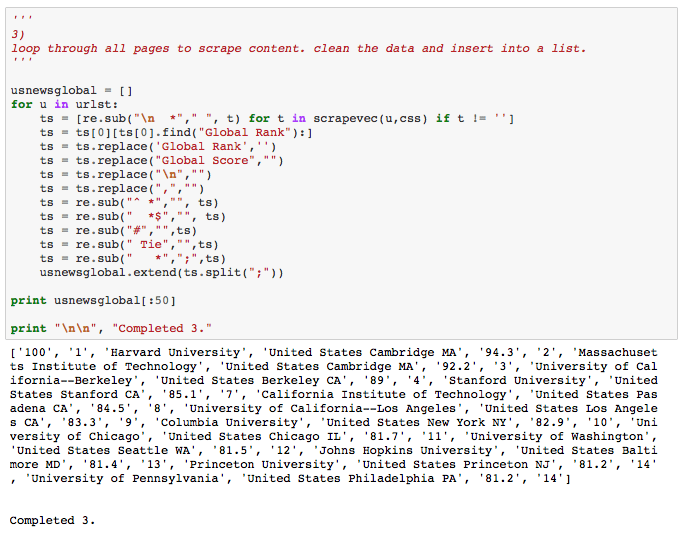
3) loops through that list, invoking scrapevec and cleaning the returned dirty data before appending individual attributes to a cumulative list.
4) reshapes the aggregate into a 181*4 pandas dataframe, using numpy arrays for intermediate help. Final munging and beautification produce the desired result – of which the first and last 20 records are displayed.

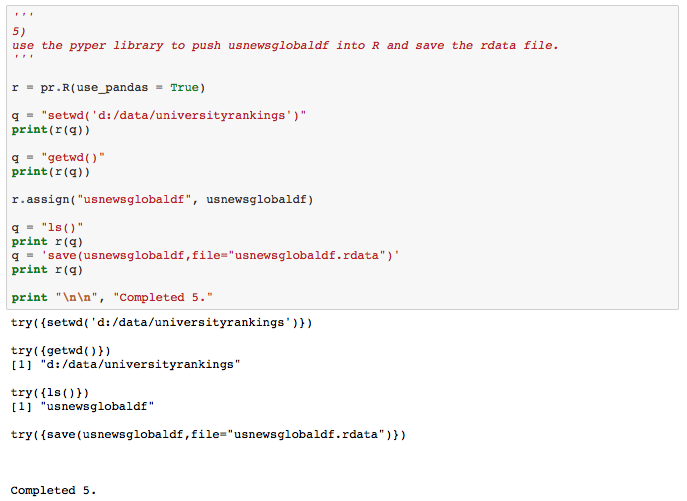
For extra credit, 5) uses the pyper package to push the pandas dataframe into R and store an rdata file with its contents.
For tabular data like these, SelectorGadget is a godsend. Given the css(s), it’s pretty straightforward to capture the desired source data using lxml. After data capture, the exercise becomes one of munging and reshaping. Once the data are in a pandas dataframe, an endless supply of analysis, visual, and statistical goodies – including a dataframe push into R – are available.
Next time I’ll revisit the same scraping exercise using R and the rvest library.