
A Data Strategy isn’t a “one and done” activity. It’s an ongoing program, built around measurable business goals, that provides a means to identify and refine deliverables on a regular basis. As business needs change, it must evolve, focusing on components where investment is practical.
An initial Data Strategy shouldn’t include everything: aiming for “good enough” is much better than getting bogged down reaching for perfection, said Evan Levy, Partner at Integral Data. Levy shared his “Data Strategy Scorecard” with participants at the DATAVERSITY® Enterprise Data World Conference. The Scorecard is a tool to help identify and prioritize goals and measure progress toward those goals.
What is Data Strategy?
A Data Strategy is “A plan designed to improve all of the ways you acquire, store, manage, share, and use data,” said Levy. It isn’t just about analytics, or the data warehouse, or ETL – it should encompass all aspects of data usage. A Data Strategy is a method or plan created to bring about a desired future, such as an achievement or a goal, he said.
A Data Strategy is typically mid- or long-term – a multi-year plan. Practically speaking, he said, the whole idea of building a strategy entails establishing a long-term goal, and then determining what steps or milestones are needed to reach that goal. Strategy is different from vision, mission goals, priorities, and plans.
Strategy is an evolving process, with regular adjustments expected as progress is measured against desired goals over longer timeframes. “There’s always an element of uncertainty about the future,” Levy said, “so strategy is more about a set of options or strategic choices, rather than a fixed plan.” It’s common for companies to re-evaluate and adjust accordingly as business goals evolve and systems or tools change.
Traditional Strategy Building Blocks
Before building a strategy, people often assume that they must have vision statements or mission statements, a SWOT analysis, or goals and objectives. These are good to have, he said, but in most instances, they are only available after the strategy analysis is completed.
“When people establish their Data Strategies, it’s typically to address limitations they have and the goals that they want. Your strategy, once established, should be able to answer these questions.” But again, Levy said, it’s after the strategy is developed, not prior. Although it can be difficult to understand the purpose of a Data Strategy, he said, it’s critically important to clearly identify goals and know how to communicate them to the intended audience.
The Core Components
Levy outlined five primary capabilities necessary for success: Identify, Provision, Store, Process, and Govern.
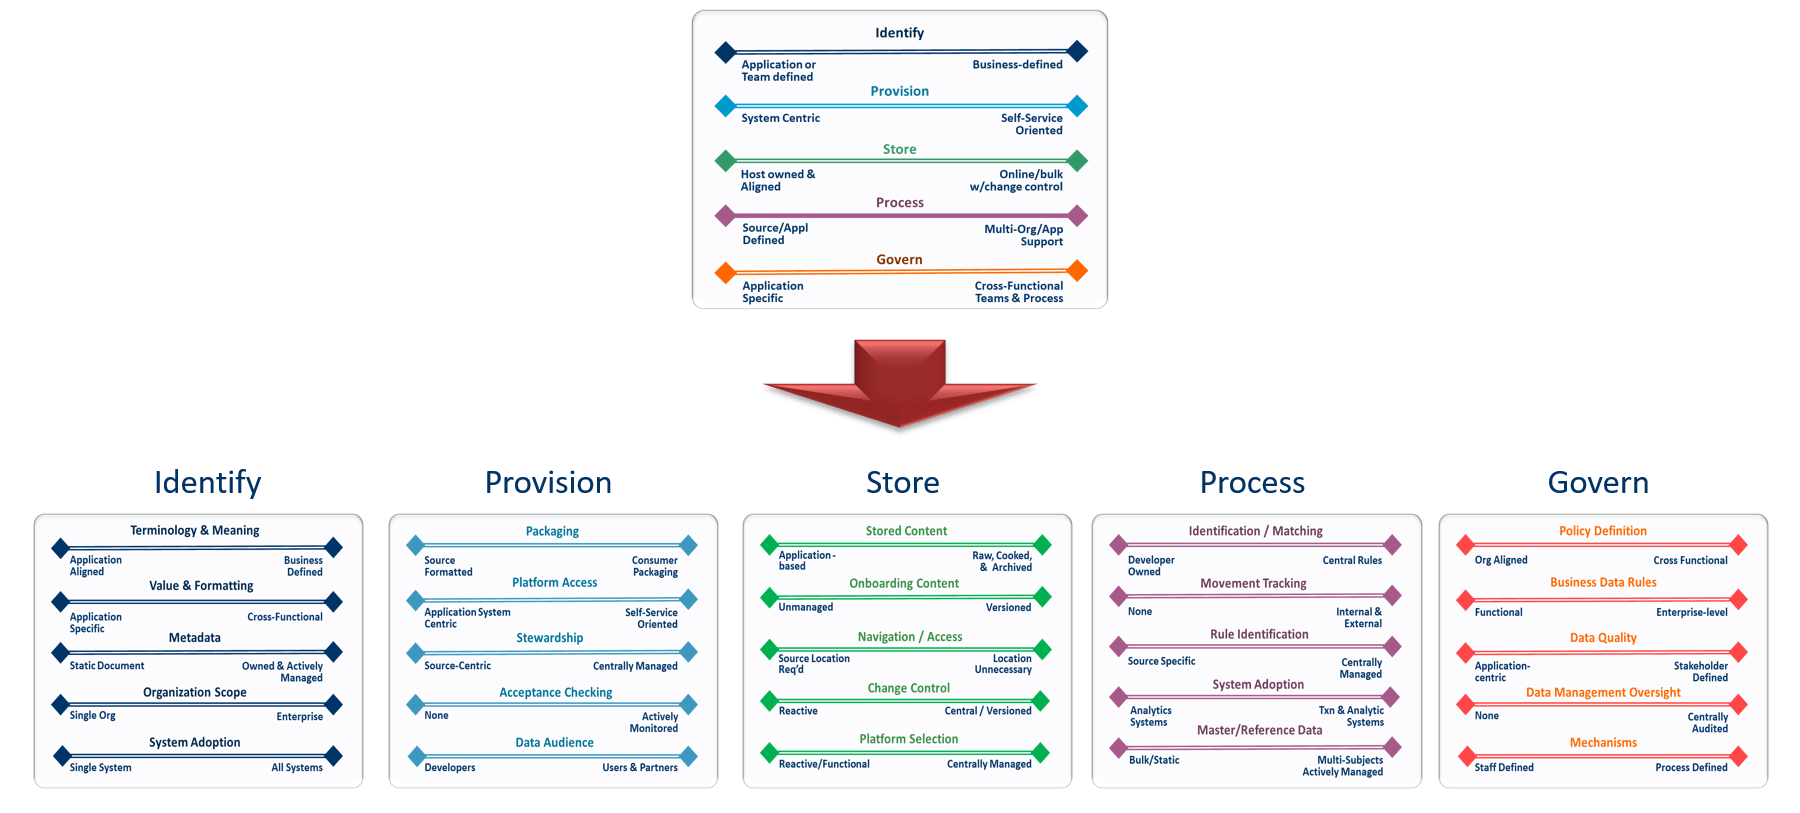
- Identify: To understand the meaning of the data regardless of its structure, origin, or location. “If I say ‘account number,’ do people understand what that means? And can they easily find that information?”
- Provision: To enable access to the data while respecting rules and guideless for its use. “Is the data packaged and ready for use?”
- Store: To ensure that data persists in a structure and location that supports access and processing across the enterprise. “Where is that data actually persisted and stored?”
- Process: To provide means for transforming, combining and moving data in multiple locations while providing a unified view. “What transformation, standardization, and integration capabilities are necessary for someone to be able to use the data?”
- Govern: To establish and communicate policy and procedure for ensuring effective data use. “Do we have the mechanisms and policies in place to establish and support rules for sharing and accessing that data?”
Data Strategy Is Not “One Size Fits All”
Needs and capabilities vary from company to company, and within companies over time. Levy offered a set of “sliders” that can be used to assess and track each of the five components.
The idea is to go through each component while looking at the environment, assessing current capabilities, and determining where changes need to be made to achieve the company’s goals. “It’s not a cookie cutter; the variations between two different companies can be dramatic. It’s really about understanding what you need to accomplish.”
Identify
Levy demonstrated how to use the different parts of the Data Strategy Scorecard. For the first component, Identify, users should ask:
- Is there a single system or are there different systems that users have to navigate and understand to find the data they want?
- How is the data represented?
- Do all users understand existing terminology or do they prefer business-defined terminology?
- Are systems used by multiple organizations or are people using different terms?
- Is there a standard way that data is formatted or are there reports where the same data is represented (or mis-represented) in a different way?
The left side of the sliders indicate an application-oriented environment, and the right side indicates a more business-defined environment. Smaller companies tend to sit farther on the left side, he said, and larger companies with more systems in place tend to lean closer to the right side.
For example, a company that prefers to use business terminology rather than technical would sit to the right on the Terminology & Meaning slider.
Levy contrasted how the process would look for the remaining components: Provision, Store, Process, and Govern.
Provision
Provision is the idea of packaging data, he said. With this slider, the left side indicates that any request for data would be a custom endeavor, requiring a developer to build something from scratch. The middle of the slider would indicate that reporting systems are well established and that data moves easily from point to point within the company. The slider to the right would indicate self-service data capability.
Store
Levy uses “Store” to indicate where data is persistent. Users should ask:
- Is data application-centric or is data raw, “cooked,” or archived?
- In what different states do people need data?
- Is this an environment where a central core group of people have to onboard data from third parties and/or internal systems?
- Can users version the data themselves?
Process
The Process slider indicates what level of expertise users need to have to interact with the data. In most data environments, data is not packaged and ready to use. Instead, it’s packaged at the convenience of the manufacturing process, resulting in big flat files or files that contain presentations or variables and values that have been repurposed—what Levy called “very kooky data types.”
The left side is where traditional labor-intensive data warehouse and BI environments sit, where developers have to go find the data in various systems, pull the data out using native utilities, and provide transformation, conversion, cleansing, and standardization. Contrast that with the right side, where tools and data are set up and ready for self-service use.
Govern
Governance is about understanding what the rules, policies, and mechanisms are to be able to share data, Levy said. “My simple view of Data Governance is that I only need governance if I have multiple people using the data.”
If data is contained in a single system, he said, the rules are already defined. The data is governed by the system rules. The moment data starts getting moved across systems and between different individuals, however, governance is required so that the rules associated with that data stay attached to that data.
Highly-regulated businesses or those working with a lot of consumer information will be on the right side of the slider, due to regulations about privacy and protection. Single business units or organizations that do not share data will be closer to the left side, because if the data sharing is not there, the need for greater governance isn’t there, he said.
The Core Components
These five components provide a means to segment out different areas responsible for Data Strategy Scorecard. In most organizations, he said, the people who own metadata and data standards are separate from the people who deal with data integration, and those people are separate from the platform and systems people, so often there are four or five different groups working together. “So, the reason for the components is to not only manage the variations in organization issues, but also all the different functional issues.”
Assessing Strengths and Needs
Levy offered worksheets along with the slide deck so participants could use them to assess their current capabilities as well as where they would like to be. “Your strategies should really be focused on where those gaps exist.”
Levy cautioned that he provided many choices so the tool can be customized for a wide variety of environments, and there is no expectation that all 25 areas should be addressed. Instead, he suggests choosing the areas that are relevant and setting aside those that aren’t. “Pick one component area, focus on that, and as you begin to understand what’s necessary, then take a look at the others and add them incrementally.”
Want to learn more about DATAVERSITY’s upcoming events? Check out our current lineup of online and face-to-face conferences here.

Here is the video of the Enterprise Data World Presentation:

Image used under license from Shutterstock.com