Click to learn more about author Thomas Frisendal.
Data Modeling – For Whom?
I am much concerned with the communicative aspects of a data model. Because data models are really vehicles of communication, we need to understand who our “readers” are. In the case of graph data models, developers are just a minority. Many more people, with business, administrative, analytical or teaching backgrounds, are consumers of data models. So, we need to talk a language that all of them can understand, and which sounds familiar to them.
The issue is not technical! The issue is the business information model. If you do not hit that right on, or if you do not use terminology that the business people use themselves, you have lost a lot of your audience.
Database veteran David McGoveran frames the issue like this:
- The IT developer’s perspective is rapid solution delivery, whereas
- The data modeler’s perspective is working with a long-term asset.
If the data you are looking at, have longer-term value and/or are directly visible to business users, you should care about the data model.
The Human Factors in Data Modeling
As a little aside, there is a lot to do for humans in Data Modeling, even given AI / ML assisted catalog building etc.:
- If data models are to be derived from the data, we need to deal with even the worst data quality challenges rather completely
- A given data set may be interpreted in more than one way, and there are bound to be situations, where human judgement is necessary
- We are still better than machines when it comes to understanding a given context. Why is that? Because humans set the rules of the context
- In our very human ways we leave room for oversights, simplifications, peculiar terminology, and laissez-faire “known errors.” The rightful owners of the business terminology are the business people, and they are more human than they are androids
- The path from data values to a context description (another way to describe what a data model is) is long and works upwards in multiple layers.
- The bottom layers is traditional stuff from Data Quality but the upper layers really do not have a good name, yet. “Smart Data Discovery” is more a marketing term and there are no clearly sovereign technologies.
End of aside.
First, we need to think about the nature of our readers, other human beings.
Perception and Cognition
“Know your audience” has always been sound advice for communicators. Our audience is business people and some IT people, who work closely with the business.
We need to know how people perceive and work with recognized information. The experts in these matters come from the realms of cognitive psychology and cognitive science in general. Cognitive psychology comprises areas of research such as categorization, knowledge representation, language, memory, perception, cognition and thinking.
I have been wondering for several years why we, the data modelers and architects, draw drawings resembling engineering blueprints, when we try to communicate? Try showing a UML class diagram to a C-level executive…
From the cognitive researchers we can pick up a number of paradigms, which have proven to work.
Concepts matter. Psychologists specialized in learning and teaching have developed the technique called concept mapping, which is used in both elementary and higher levels of education with very good results. It is a visual structure that is easy to communicate. A good place to host the user data stories, which we need for determining the requirements of the business.
Cognition is spatial. There are strong indications that the way our perception and recall work is derived is from our innate capabilities of visually processing our environment. In other words, spatial structures are what we are talking about. On one side this points in the direction of visualization. And on the other side it implies working with what is similar to multidimensional coordinates. Conceptual spaces are a good word to search for on the Internet.
Semantics are important. Since around the year 2000, the “semantic web community” have worked with implementing semantic technologies. At the time of this writing the field is blossoming with brand names running their business on top of semantic technologies. If in doubt, find out what Google Knowledge Graph is about and try it out for yourself.
Cognitive computing is here. Not only knowledge graphs but much more integrated solutions are now readily available from Silicon Valley and elsewhere. Check out the data catalog vendors, who do AI-based data discovery, and you will know what I mean.
Let me re-emphasize visualization. It is really a powerful thing. Note how easy it is be deceived, as in this “Op art” cartoon that creates a 3-D impression in our minds:
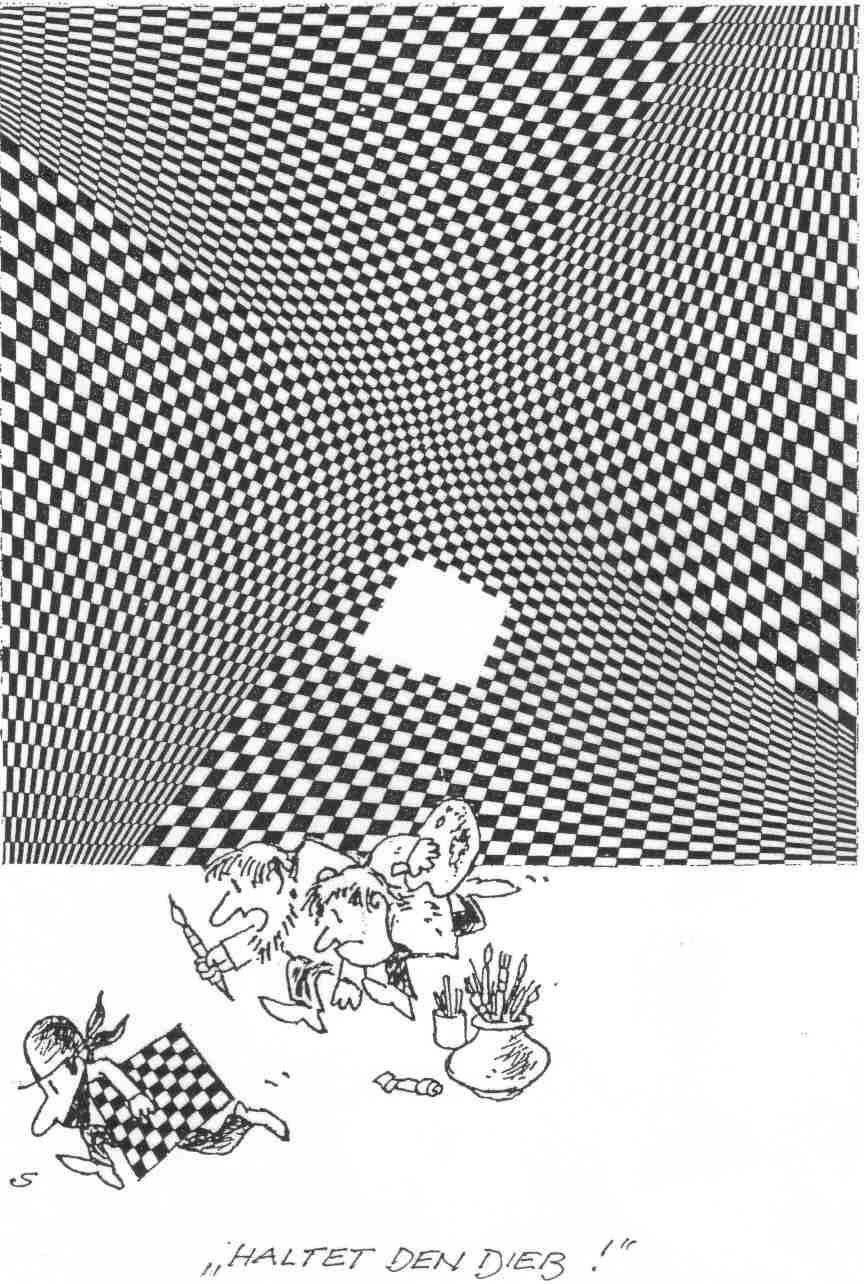
“Haltet den Dieb!” means “Stop thief!” in German. The cartoon is by Heini Scheffler, CC BY-SA 3.0 (http://creativecommons.org/licenses/by-sa/3.0), via Wikimedia Commons, (https://commons.wikimedia.org/wiki/File%3ASchachBrettDieb.jpg).
Visual perception works on approximative heuristics, which makes sense, if you are in the jungle and something that might be a tiger might be looking your way.
Visuals talk directly to us, and our perceptive systems have been strengthened by millions of years of evolution and work quite well even on erroneous input:
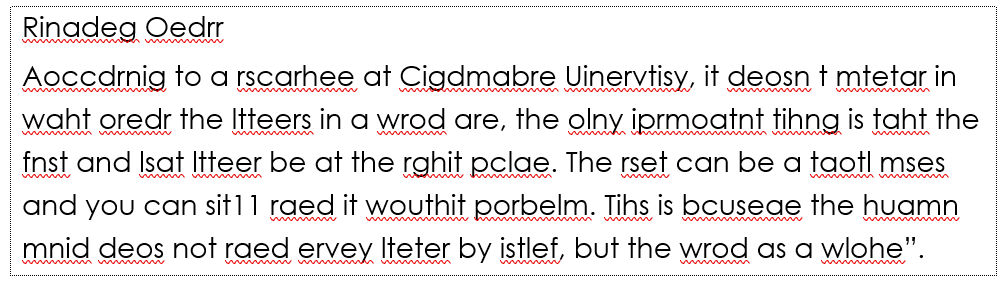
… is an example highlighting how memory supported the quick scanning of words in a document, showing that not all letters are needed.
Both examples above are used in chapter 3 (Human Perception and Information Processing) of the book Interactive Data Visualization: Foundations, Techniques, and Applications, Second Edition, by Matthew O. Ward, Georges Grinstein, Daniel Keim, CRC Press, 2015.
I prefer the visuals over reading the text… And that is what we do, as you can see above. We read words, not letters.
And also some additional emphasis goes to the multidimensional aspect: The success of the multidimensional data model in business intelligence and analytics is overwhelming. Thinking dimensionally comes natural to us.
That is probably because it is very similar to spatial cognition. At the “junction” of several dimensions, you find the information, you need. So, multidimensional solutions give natural answers to the key question of location: “Where is this?”. In fact a “location” in a context is nothing more than (multidimensional) coordinates. Spatial thinking is again working wonders.
Recent research indicates that the hippocampi organs in the brain play a central role in providing access to the navigable representation of the both sensory experiences and conceptual constructs. The hippocampi are two finger size structures in the center of the brain (here in cross-section):
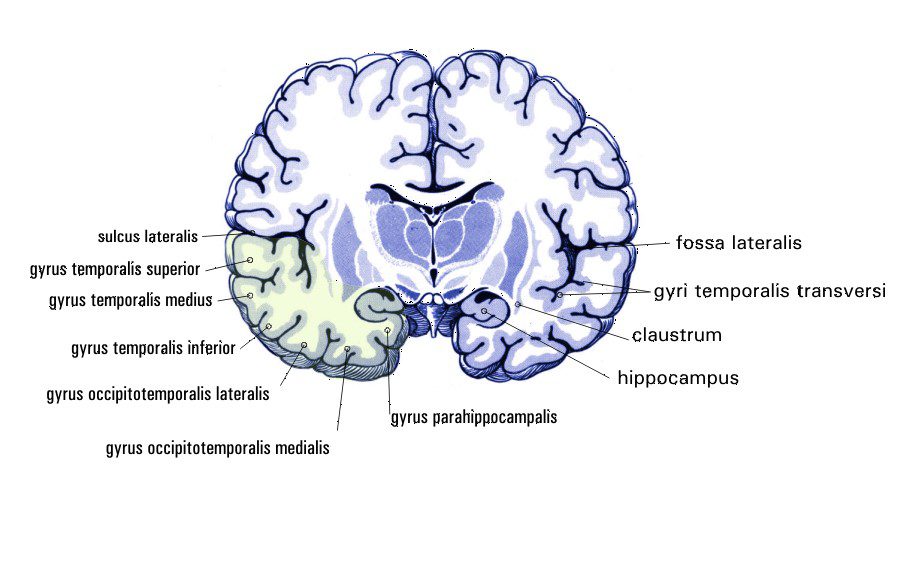
CC-BY-SA-3.0 (http://creativecommons.org/licenses/by-sa/3.0/), via Wikimedia Commons
The cortex layers of the brain consists of billions of neurons, and the memory creation, and hence recognition, are based on reinstatement of paths between locations. (Which are targets of different perceptions created by senses and reinstatement.) Memories that last longer than, say, half a minute, strengthen connections between the relevant parts of the cortex and your hippocampi. Since the hippocampi have connections in many places, they are thought to play the role of the integrator.
This research lead to the 2014 Nobel Prize in Physiology or Medicine with one half to John O’Keefe and the other half jointly to May-Britt Moser and Edvard I. Moser for their discoveries of cells that constitute a positioning system in the brain.
Having an IT mindset, this reminds me of some sort of a hyper index. Associations can probably also be explained by the way the hippocampi work. (See for example New Scientist’s cover article from November 28th, 2015, “Shadows of the past”, Clare Wilson, which can be found here at the University of Leicester.
Powerful communication can be established using the right brain’s physical senses. We are around 80% visual in dealing with our surroundings, so using visualization is a must. Brains are built, not least, for navigation. That is why structured representations in 3-dimensional space are most effective. And learning is enforced by organized information according to the findings of educational psychologists.
Concept Models
Concept mapping comes from learning psychology and has been proven to be a tool equally well used by both business experts and business analysts. Writers such as Moon, Hoffman, Novak, Canas, 1998, 2011 and yours humbly in my 2013 book.
Concept mapping deals with people, language and meaning, not engineering. Learning from the business what the business is doing and where it wants to go is a people issue. It involves brainstorming workshops, mapping the language of the business and getting the meanings right.
The “as-is” situation is not well defined (and fragmented, and redundant, and …) and it may need some rework on the fly. Finding out where the business wants to go is also learning.
Concept mapping is intuitive visual communication and has proven to be highly successful in business analysis. Conceptual modeling (UML and Entity-Relationship diagrams) failed as business-side tools, but concept mapping coming from educational psychology is readily accepted in the business communities.
Contrary to common wisdom, business analysis is not “just a documentation issue”. It is a learning process both for the analyst, but also for the business itself. Concept mapping works in this context because it is based on psychology (the theory of meaningful learning), not on an engineering mindset.
Let us look at a very simple example, The EU-Rent Car Rental. The EU-Rent Car Rental fictitious business is used in the OMG documentation for the Semantics for Business Rules and Vocabulary standard, SBVR. Here we just use a little bit of it to be drawn as a concept map:

The diagram is a
concept map, and it really speaks for itself, which is the
whole idea. Notice that you can read little sentences like “Customer issues
Booking” and “Car Group has a Rate” and so forth. The sentences are visual,
they are the connecting lines between the concepts. Concept maps can be drawn easily in
brainstorming style workshops and they are easy to maintain, also for
non-technical users. And, subsequently, concept maps can be redrawn into
concept models.
Concept maps were originally designed and developed by Professor Joseph Novak (1990, 1998, 2008) with a learning focus. The theory behind concept maps is based on Professor D. Ausubel’s work on meaningful learning. The theory of meaningful learning (as it is also called) suggests that learning is based on representational and combinatorial processes, which occur when you receive information.
In other words, there are two processes: Discovery (of information) that leads to reception of the information, integrated with what the learner already knows. In this manner concept mapping is not only facilitating learning, but also creativity.
The key is to depict the relationships between the basic concepts and terms that will be used. Learning then takes place by assimilating new concepts into existing conceptual structures known to the learner. That is precisely what Professor Novak designed concept maps to do (Novak 2008). By way of concept mapping (the diagrams), we make knowledge explicit.
I like the psychological aspects of concept mapping and it is because of them that I recommend it for business-facing concept models. This is an area with some standardization:
- IIBA’s Business Analysis Body of Knowledge (BABOK) version 3 devotes a new section to concept models
- A solid standard exists for concept models – OMG‘s Semantics of Business Vocabulary and Business Rules (SBVR) as mentioned above
- Ronald G. Ross has recently (2020, 2nd edition) published a book about vocabulary and Concept Models (Business Knowledge Blueprints – Enabling Your Data to Speak the Language of the Business).
Conceptual Spaces
We (the humans) have striven after understanding the structure of meaning for probably as long as speech has existed. Since data models are “speaking” to its readers we need to give thought to the way we humans actually work with these things.
Advances in both neuroscience and cognitive science still point in many directions (because there are many issues), but there is a clear convergence towards what is called Cognitive Spaces (see for example The Geometry of Meaning – Semantics based on Conceptual Spaces, Peter Gärdenfors, MIT Press, 2014).
Meaning domains consist of a set of values, which are points in a space, which is structured in a way according to categories / qualities / dimensions (pick your choice). In this manner there is a geometrical distance between objects, which is a more precise representation than the brute force “similarity” measured by machine learning algorithms, for example.
Note that there may exist both perceived qualities, which we handle psychologically (sensory data of color perception, for example) and abstract qualities subject to cultural variations.

Gärdenfors uses an example of skin colors within the complete spindle of colors. I created a simplified representation:

Objects come in categories, which are related, frequently in quasi-hierarchical ways. At the bottom levels we find the individual objects (me, for example) having coordinates locating me specifically in the right, bottom-level subcategories relevant to the individual, who is trying to figure out, who I am. Adjectives (properties) are certainly parts of the picture. Categories (quality dimensions according to Gärdenfors) also cover actions and events, meaning that also verbs fit into the conceptual space.
My reasons for putting emphasis on these matters is that they are important for making decisions about how to represent data models. It is a pretty obvious observation that networks of directed objects (semantic graphs) are certainly a very intuitive way of representing semantic structures. And they are the heart of the matter in Data Modeling.
Knowledge Graphs
Google has introduced the new generation of Google search, called “knowledge graphs” and it is something that deals with meaning: “The words you use in formulating your search can often have more than one meaning. With the knowledge graph we can understand the difference, and help you narrow your results to find just the answers you’re looking for”.
When you look into knowledge graph technology in more detail you find out that a “knowledge graph” is pretty much the same kind of structure as a concept model (supplemented with technical details, of course). Google “Knowledge Graph”, and you will see their knowledge graph in action.
Recent Developments: The Eyes Have It!
Data models are vehicles of human communication. 80 % of our cognition is visual. As previously reported in this blog, I am currently studying this book: Mind in Motion: How Action Shapes Thought by Barbara Tversky (prof. emerita in psychology at Stanford) from 2019. Here is a recap of some of her findings as bullet points describing her “Nine Laws of Cognition”:
- There are no benefits without costs
- Action molds perception
- Feeling comes first
- The mind can override perception
- Cognition mirrors perception
- Spatial thinking is the foundation of abstract thought
- The mind fills in missing information
- When thought overflows the mind, the mind puts it into the world
- We organize the stuff in the world the way we organize the stuff in the mind.
And it can be expressed even more compact by way of her two “General Cognitive Design Principles”:
- Principle of Correspondence
- The content and form of the representation should match the content and form of the targeted concepts
- Principle of Use
- The representation should promote efficient accomplishment of the targeted tasks
In other words, it (the communication) should be easily recognizable and it should be obvious to the consumer, how it (the communication) can help with the tasks that are important in the context. Sounds like a good data model to me!
I am going to return to Barbara Tversky’s work in later blogposts.
Conclusion: The blogpost effectively summarizes why graph data models are such powerful means of communication. That is my honest and humble opinion.