Click here to learn more about author Steve Miller. Read Part 1 of this blog series here.
Between R and Python, analytics pros are covered on most data science bases R-Python. In last month’s blog, I discussed simple webscraping using Python in a Jupyter notebbok, the nifty css-generating tool SelectorGadget, and the Python XML and HTML handling package lxml. This month I turn to R in Jupyter and and a similarly-focused package, rvest, written by R luminary Hadley Wickham.
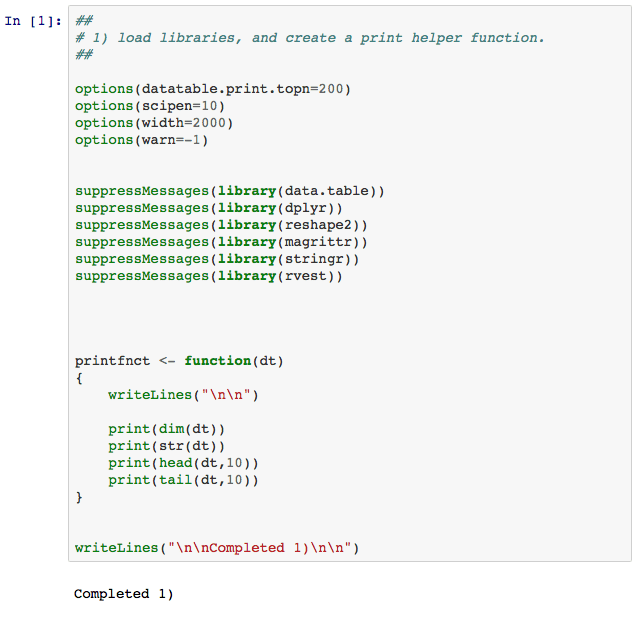
Let’s take a look at the code. 1) simply loads the relevant libraries and defines a helper print function.
2) defines a simple routine that wrappers lower level rvestl functions to scrape data from a given url and css. The url in this instance points to a web page identifying members of the UK’s House of Commons. SelectorGadget suggests 2 separate css’s of interest, the first pointing to column names, the second to MP information name and consituency. scrapevec is thus invoked twice to return the data in vectors. printfnct shows the first and last 10 elements of the dirty data.


Yuch! So now 3) begins a data wrangling exercise to both clean up and reshape the vector data. Let’s first remove superfluous elements of the ilk “back to the top” and eliminate excess blanks and redundant carriage control, newline character pairs. Also, let’s reshape the vector into a data.frame to begin to look like something we’d wish to work with.


Progress. In 4), we turn to “normalizing” the data.frame, removing “party” from the surname_firstname column into its own attribute and splitting the remaining surname_firstname into two fields. We then rename the columns, take a look at our work of art, and tally party frequencies.


I’m living quite dangerously, overwriting the parliament variable in each cell. When something goes wrong, I have to go back to the top of the script and start anew.
The scraping/wrangling metaphor presented here is one that’s often useful for programming in both R and Python: For a given url, first use SelectorGadget to identify css’s of interest. Then deploy variants of the scrapevec functions to deliver data to vectors/lists. At that point, use grep, string replace, etc., functions to clean up the data. Finally, reshape the vector/lists into data.frames and tidy up the munging.
Though R’s probably not as robust for data wrangling as Python, it’s still quite powerful in its own right, suitable for pretty hefty data lifting. I’ll continue to illustrate use of both Python and R for mundane and not so mundane data science tasks in upcoming blogs.